Campaign Reports
The Reports tab in the Campaigns section: summary, delivery funnel, the table of campaigns and automations, what each metric means and how to export a CSV.
The “Reports” tab in the Campaigns section shows what came of the campaigns you sent: how many went out, how many were delivered, how many were opened and clicked. One-off campaigns and automations sit in the same table.
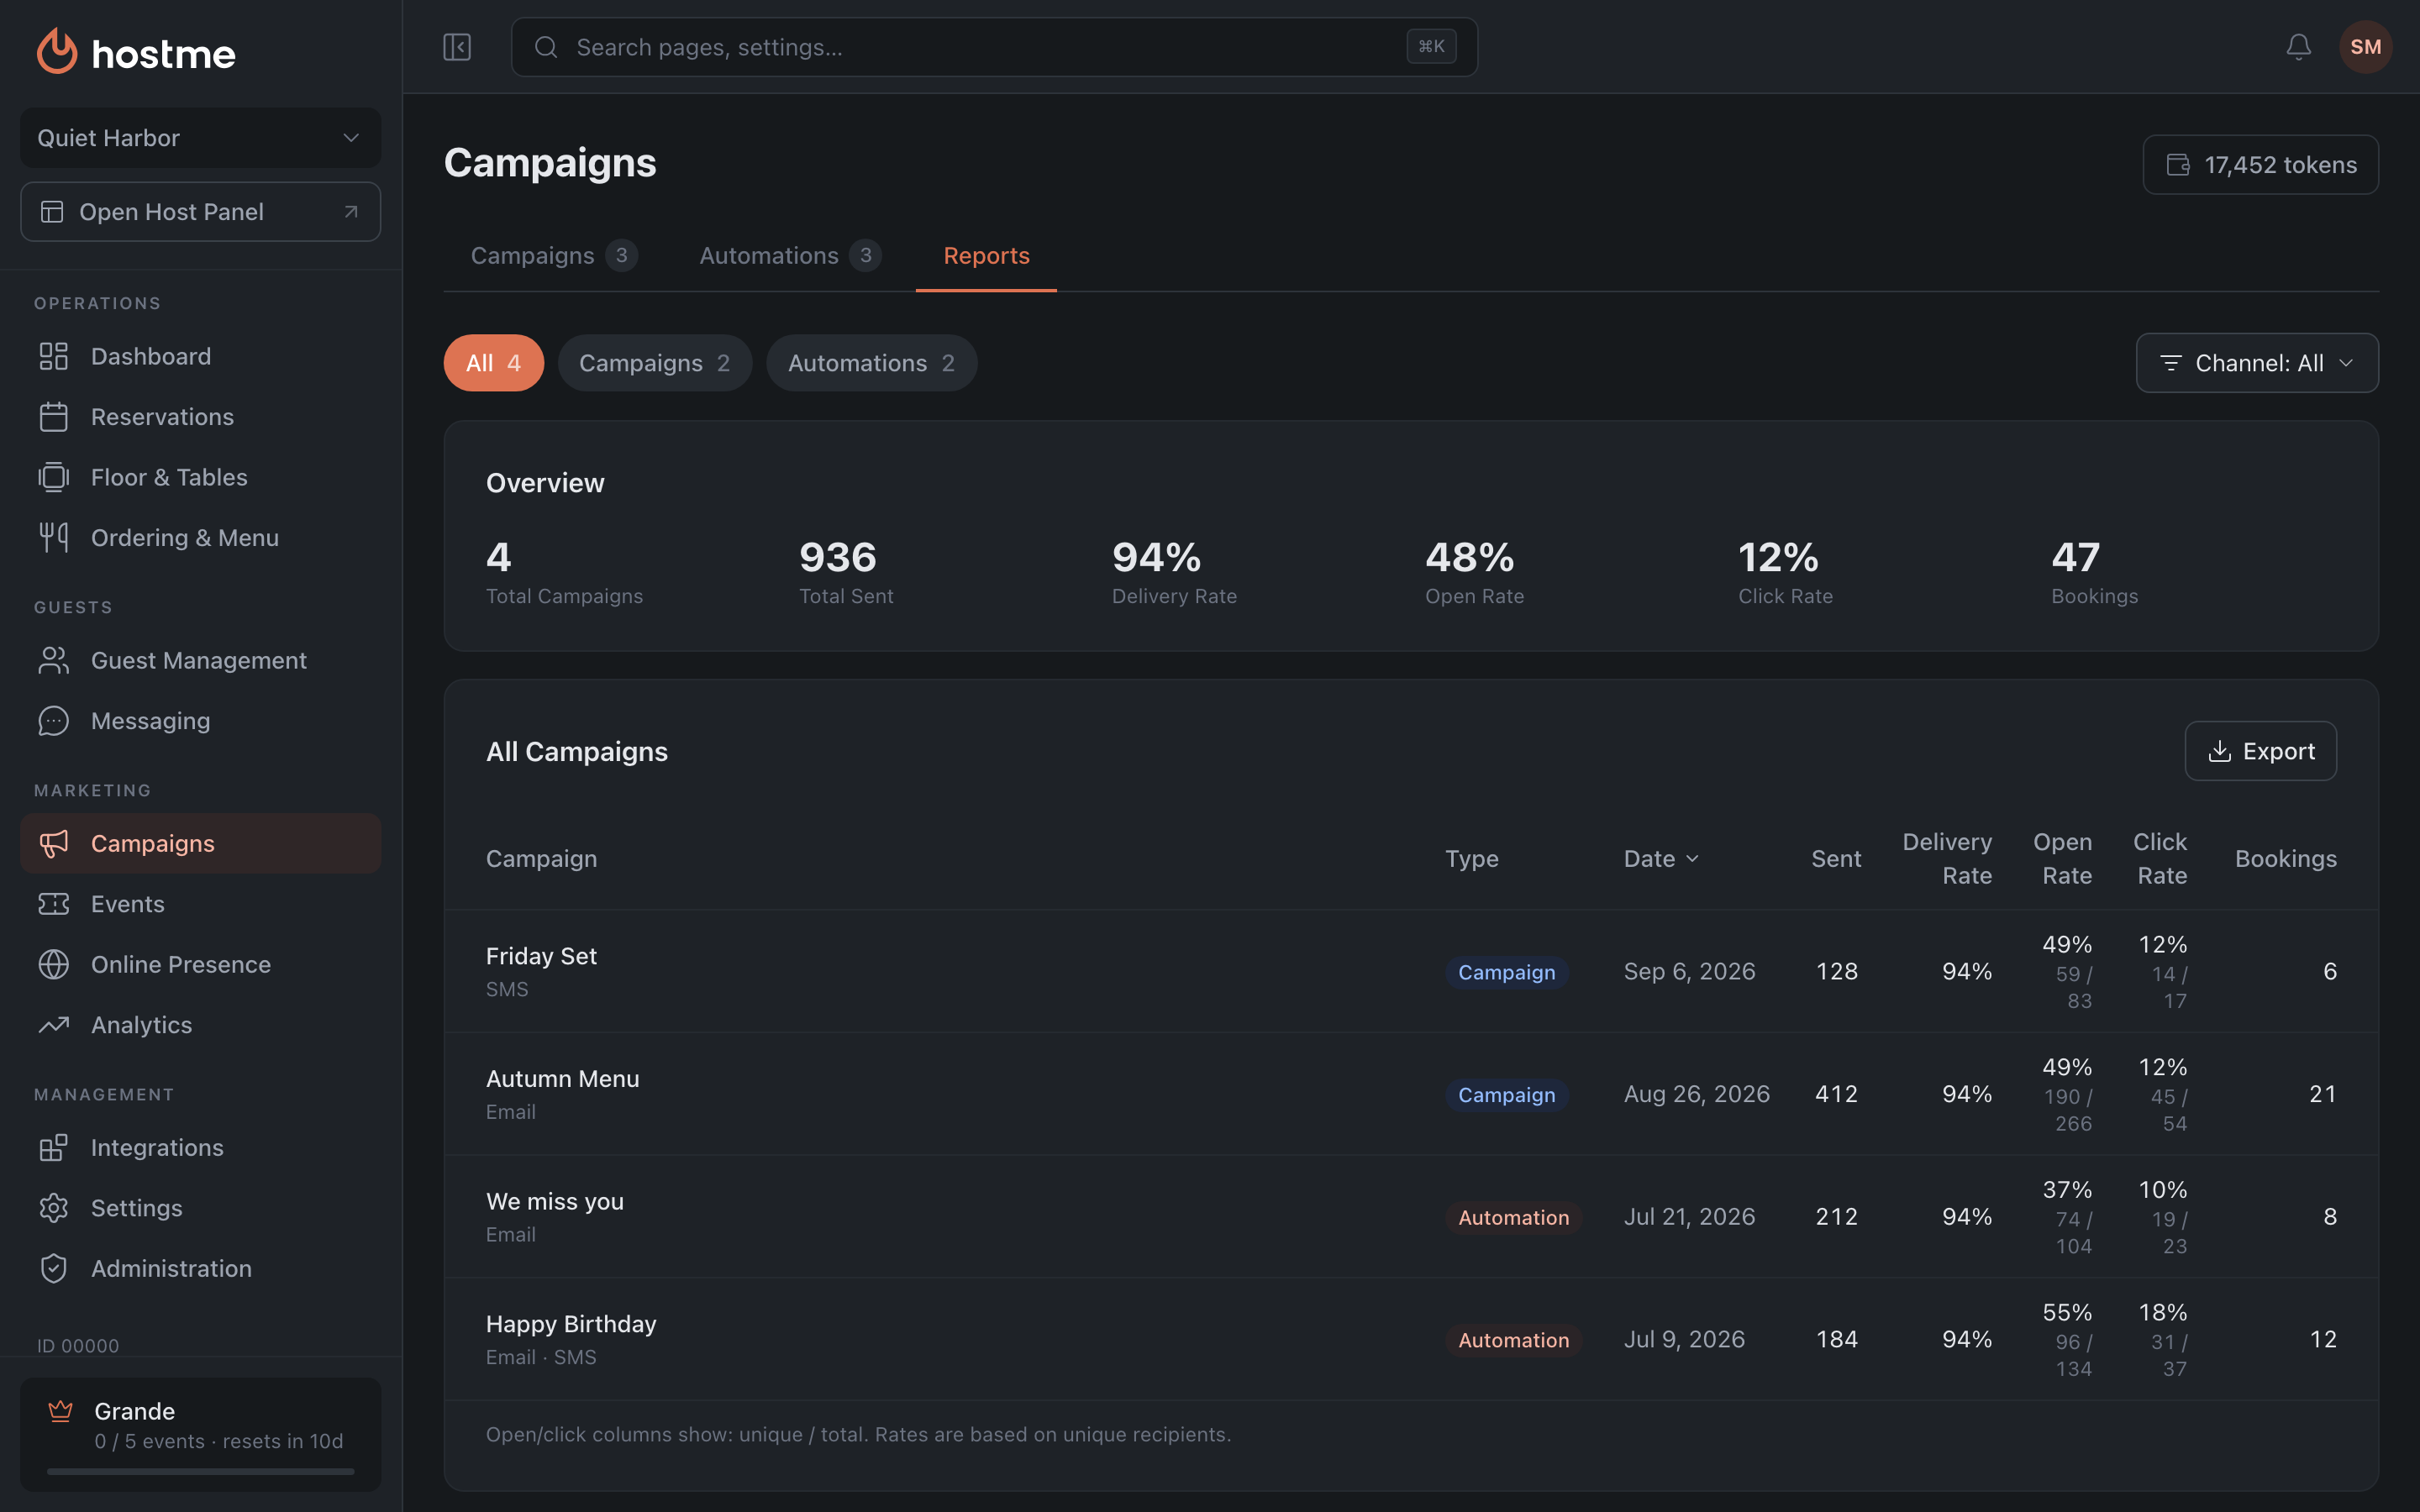
Filters
- Type — All · Campaigns · Automations. Each option has a counter next to it.
- Channel — Email, SMS, WhatsApp.
Everything below — the summary, the funnel, the table — is calculated over the filtered rows. Switch the type to “Automations” and the summary is recalculated for automations only.
Summary
Tiles above the table: “Total Campaigns”, “Total Sent”, three rates — delivered, opened, clicked — and “Bookings”: how many reservations came in from these campaigns.
If many campaigns have accumulated, a caveat appears above the tiles: “Showing your most recent campaigns — older ones aren’t included in these totals yet.” In other words, it’s not “all time” but the loaded sample. With a small number of campaigns the line is absent — meaning everything is counted.
What each metric means
The denominators differ between the rates, and that’s the main thing to remember:
| Metric in the interface | How it’s calculated |
|---|---|
| Delivered | delivered ÷ sent |
| Open Rate | unique opens ÷ delivered |
| Click Rate | unique clicks ÷ delivered |
Percentages are rounded to whole numbers.
Opens and clicks are counted against delivered, not sent. This is the fairer approach: an email that never arrived could not have been opened by anyone, and including it in the denominator would understate the result because of problems on the mail side.
In the table, the “Open Rate” and “Click Rate” columns show two numbers separated by a slash — unique / total. One guest may have opened the email three times: they count once in “unique” and three times in “total”. Percentages are based on unique.
Single-campaign report
Clicking a table row expands the “Report” panel. You can also pick a campaign from the “Select a campaign…” dropdown — more convenient when there are many rows.
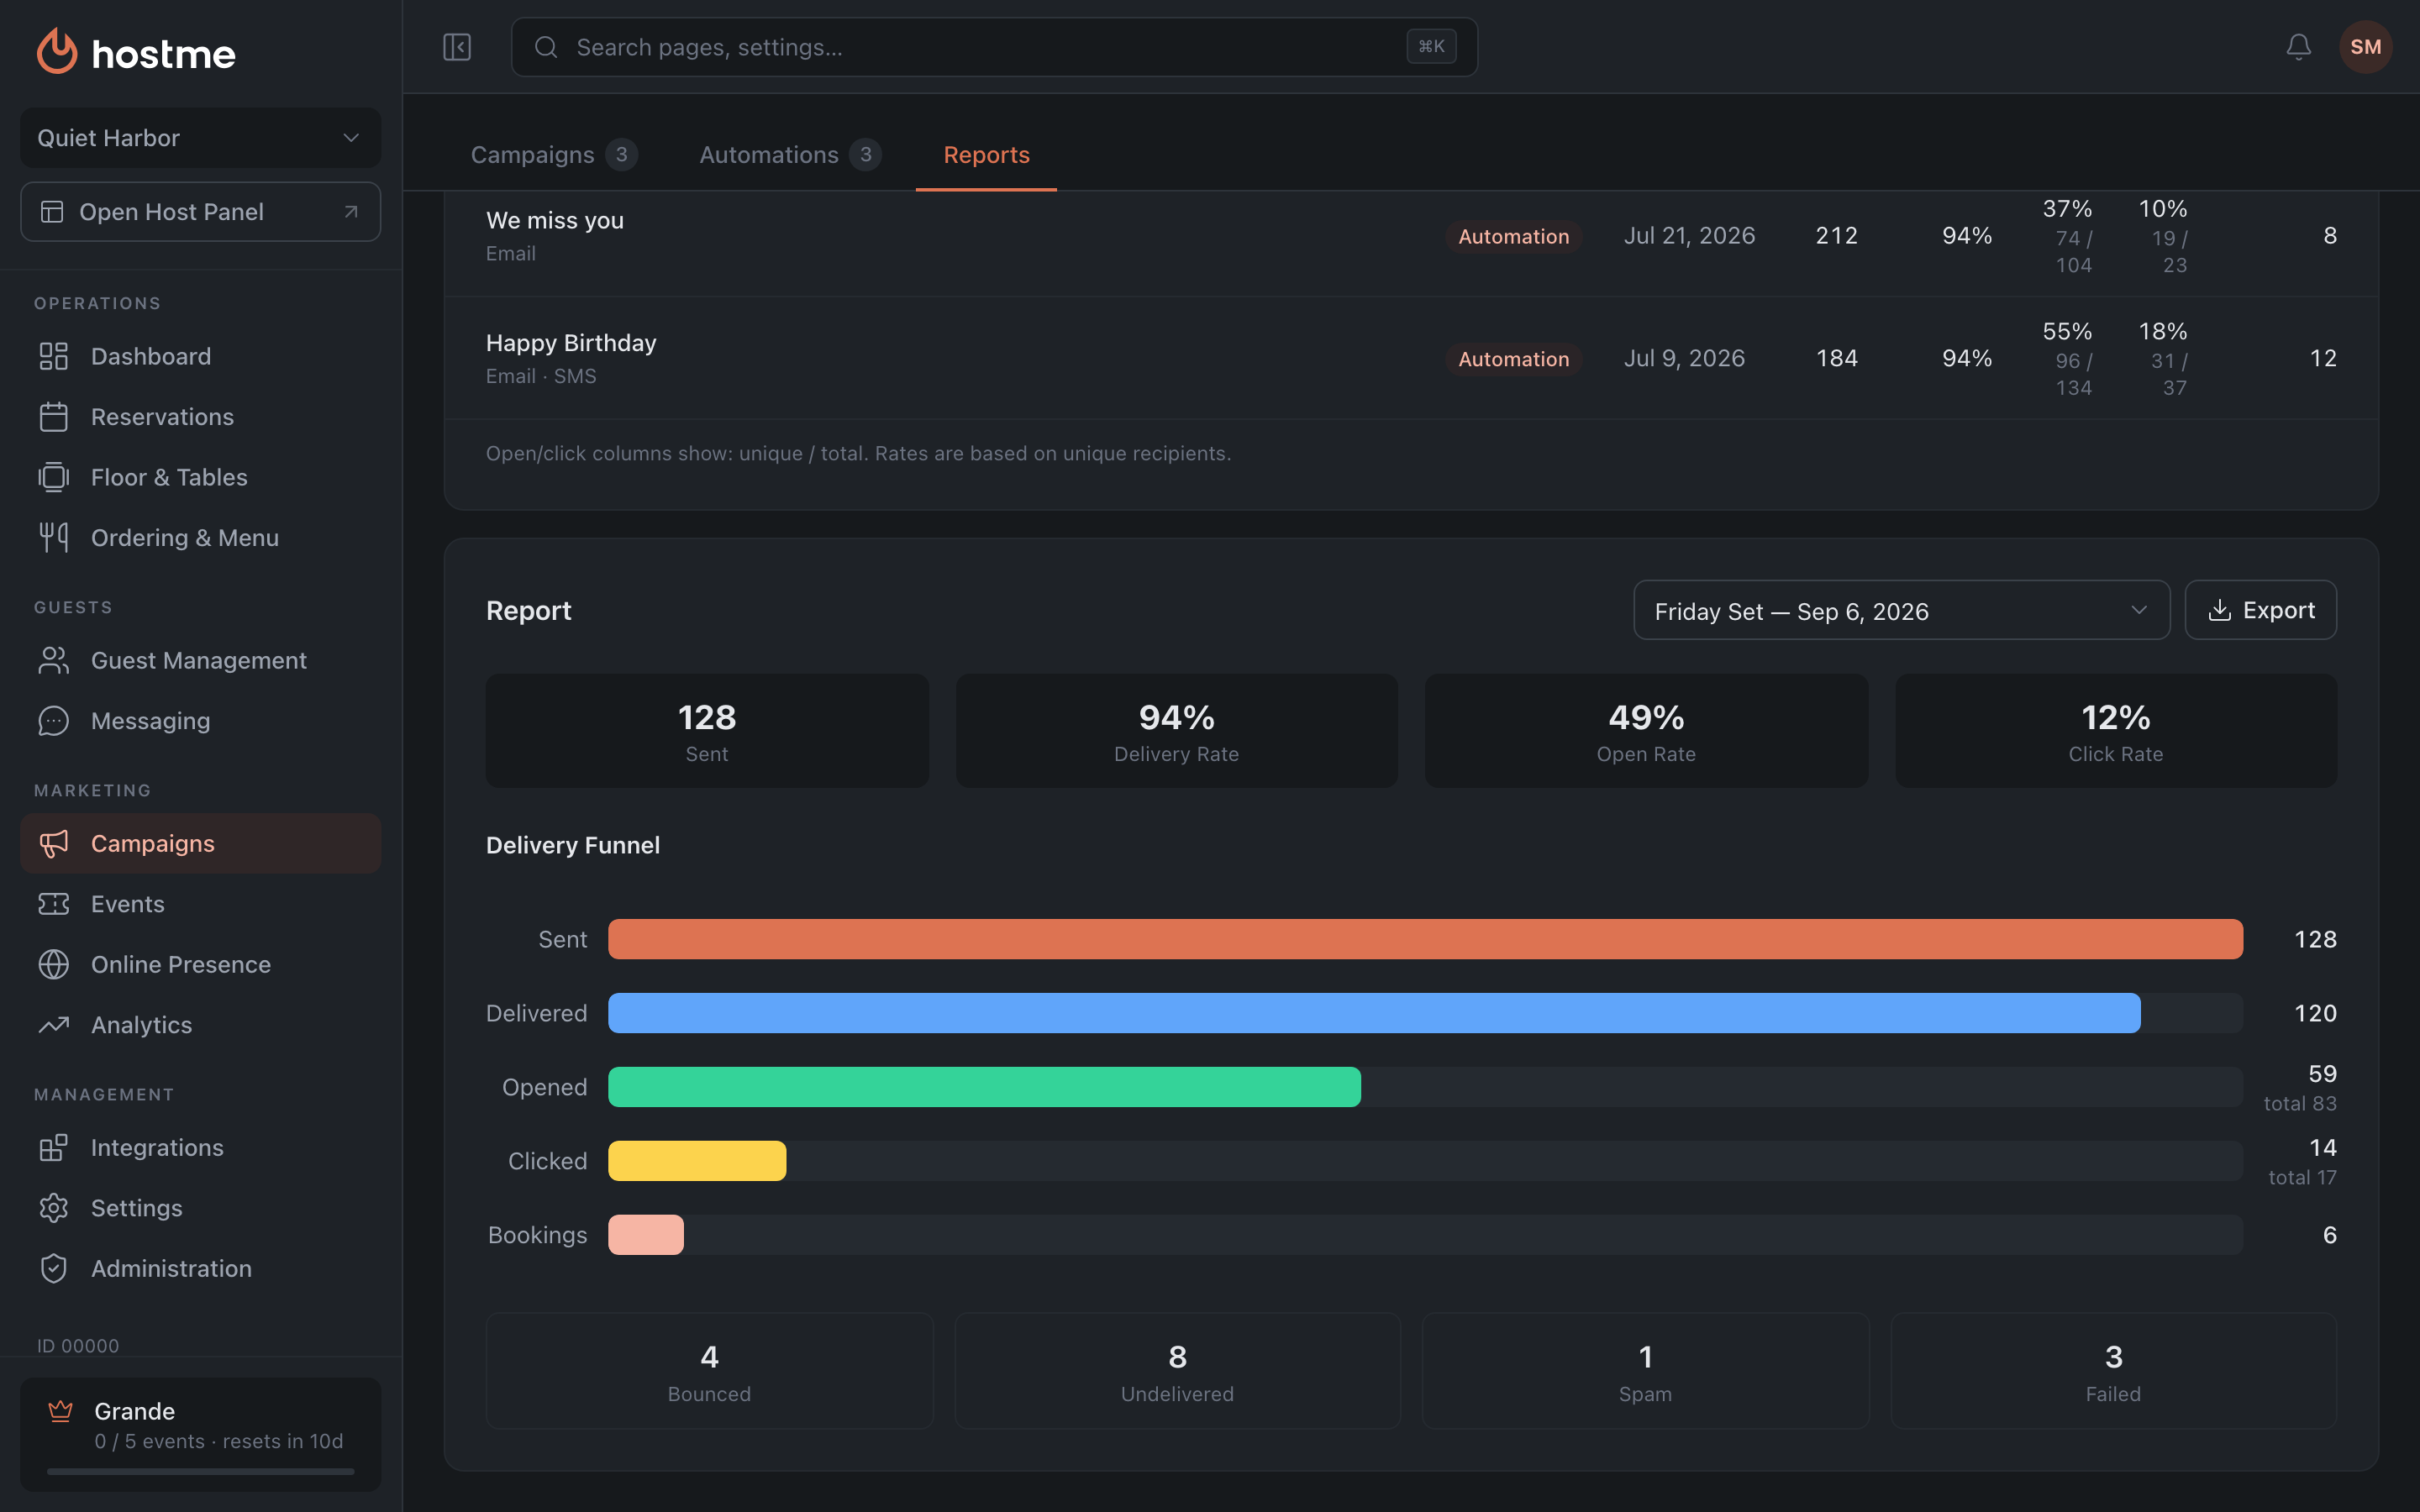
Inside is the delivery funnel: sent → delivered → opened → clicked → bookings. It shows where the biggest drop-off happens. This is the statistics of the selected campaign, not a summary over the filter.
Below it the failures are broken down: “Undelivered”, “Bounced”, “Failed”, “Spam”. These are different things: “bounced” is a rejection on the recipient’s side, “spam” means the email arrived but was flagged as unwanted.
Until a row is selected, the panel asks you to choose a campaign.
Export to CSV
There are two exports, and they produce different files:
- Export of the whole table — all rows of the current filter, 15 columns: type, trigger, campaign, channels, date, sent, delivered, delivery rate %, unique opens, total opens, open rate %, unique clicks, total clicks, click rate %, bookings.
- Export of a single campaign — from the expanded report, 19 columns: the same 15 plus the failure breakdown — bounced, undelivered, spam, failed.
Column headers in the file are always in English (Type, Campaign, Sent…) regardless of the interface language — that way they open in any spreadsheet without encoding issues. Channels are listed separated by |, the date is in YYYY-MM-DD format, and the row order matches the table’s current sort. The file name includes the export date.
What’s next
- Campaigns — how to create and send a campaign.
- Automations — automatic sends by trigger.
- Guide: measure a campaign — step by step from sending to conclusions.