Analytics
A walkthrough of the Analytics section — metrics on bookings, orders, no-shows, waitlist, tables and guests, with export.
The Analytics section shows how the restaurant is doing: bookings, guests, no-shows, table utilization and other metrics for the selected period. All charts are built from your real data.
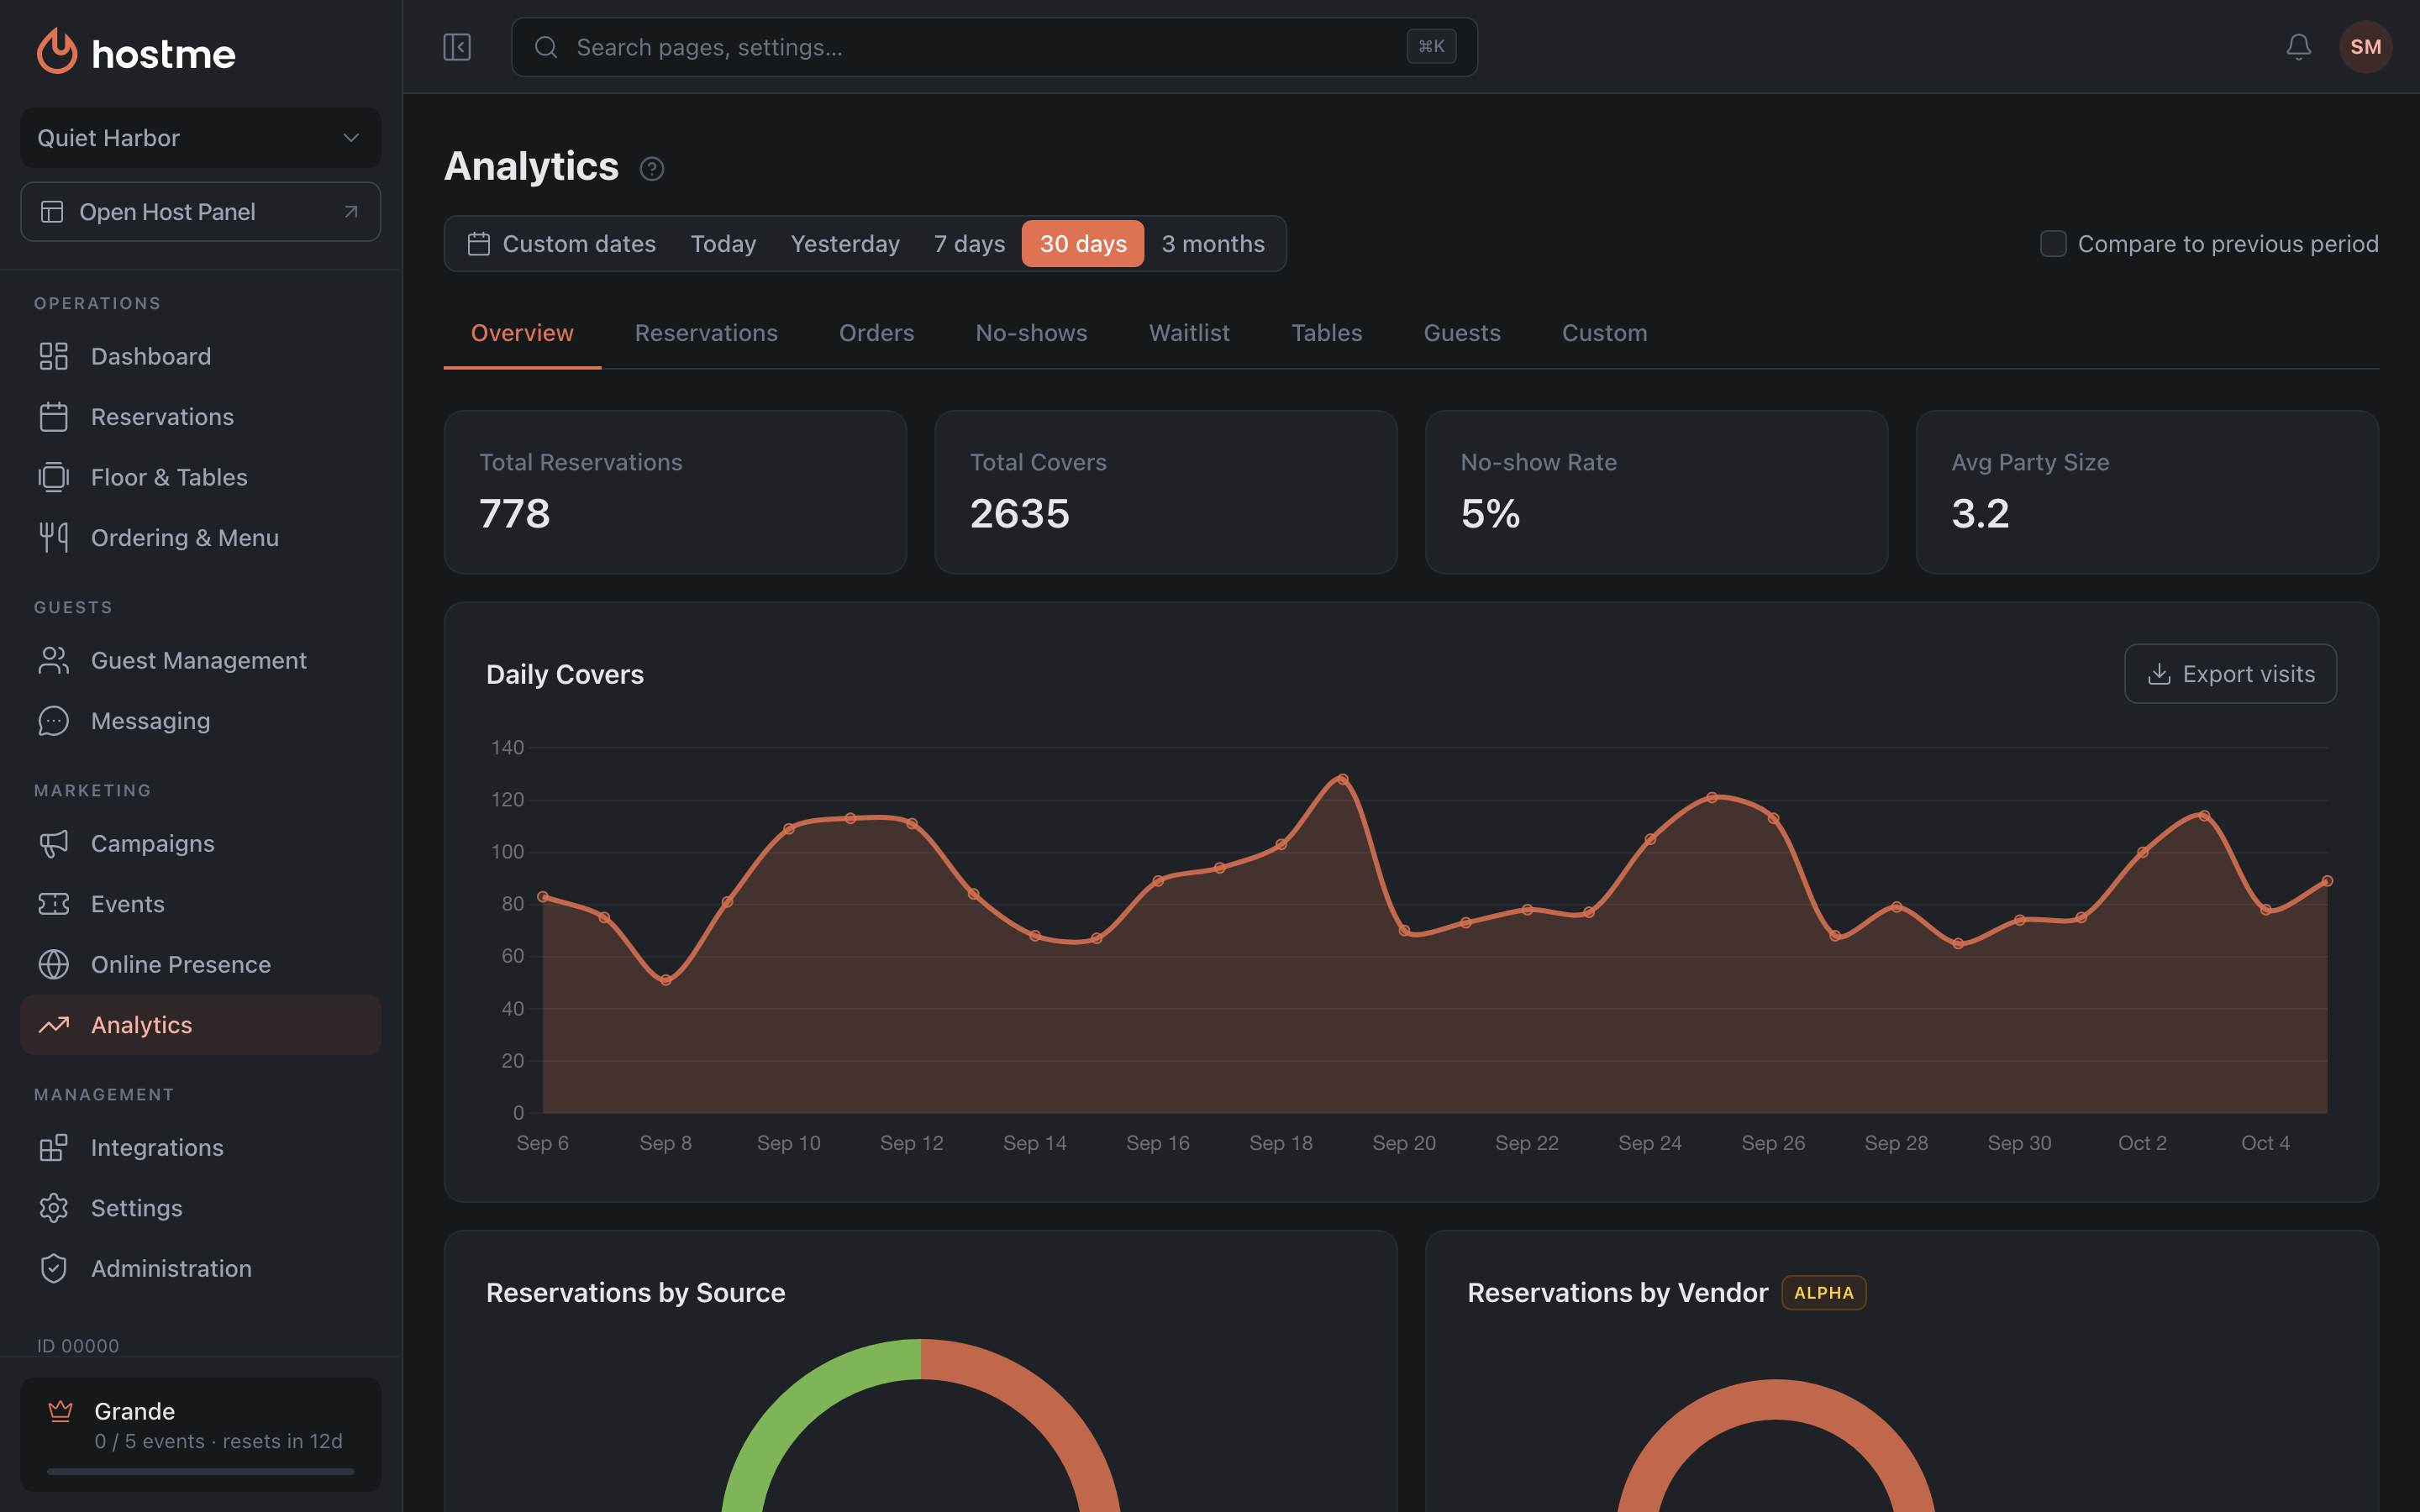
Period
Above the tabs — the period selector: Today, Yesterday, 7 days, 30 days, 3 months or Custom dates. In Custom dates you set a range in the calendar or the last few days or weeks — up to 90 days. On a phone the period is picked with a single button.
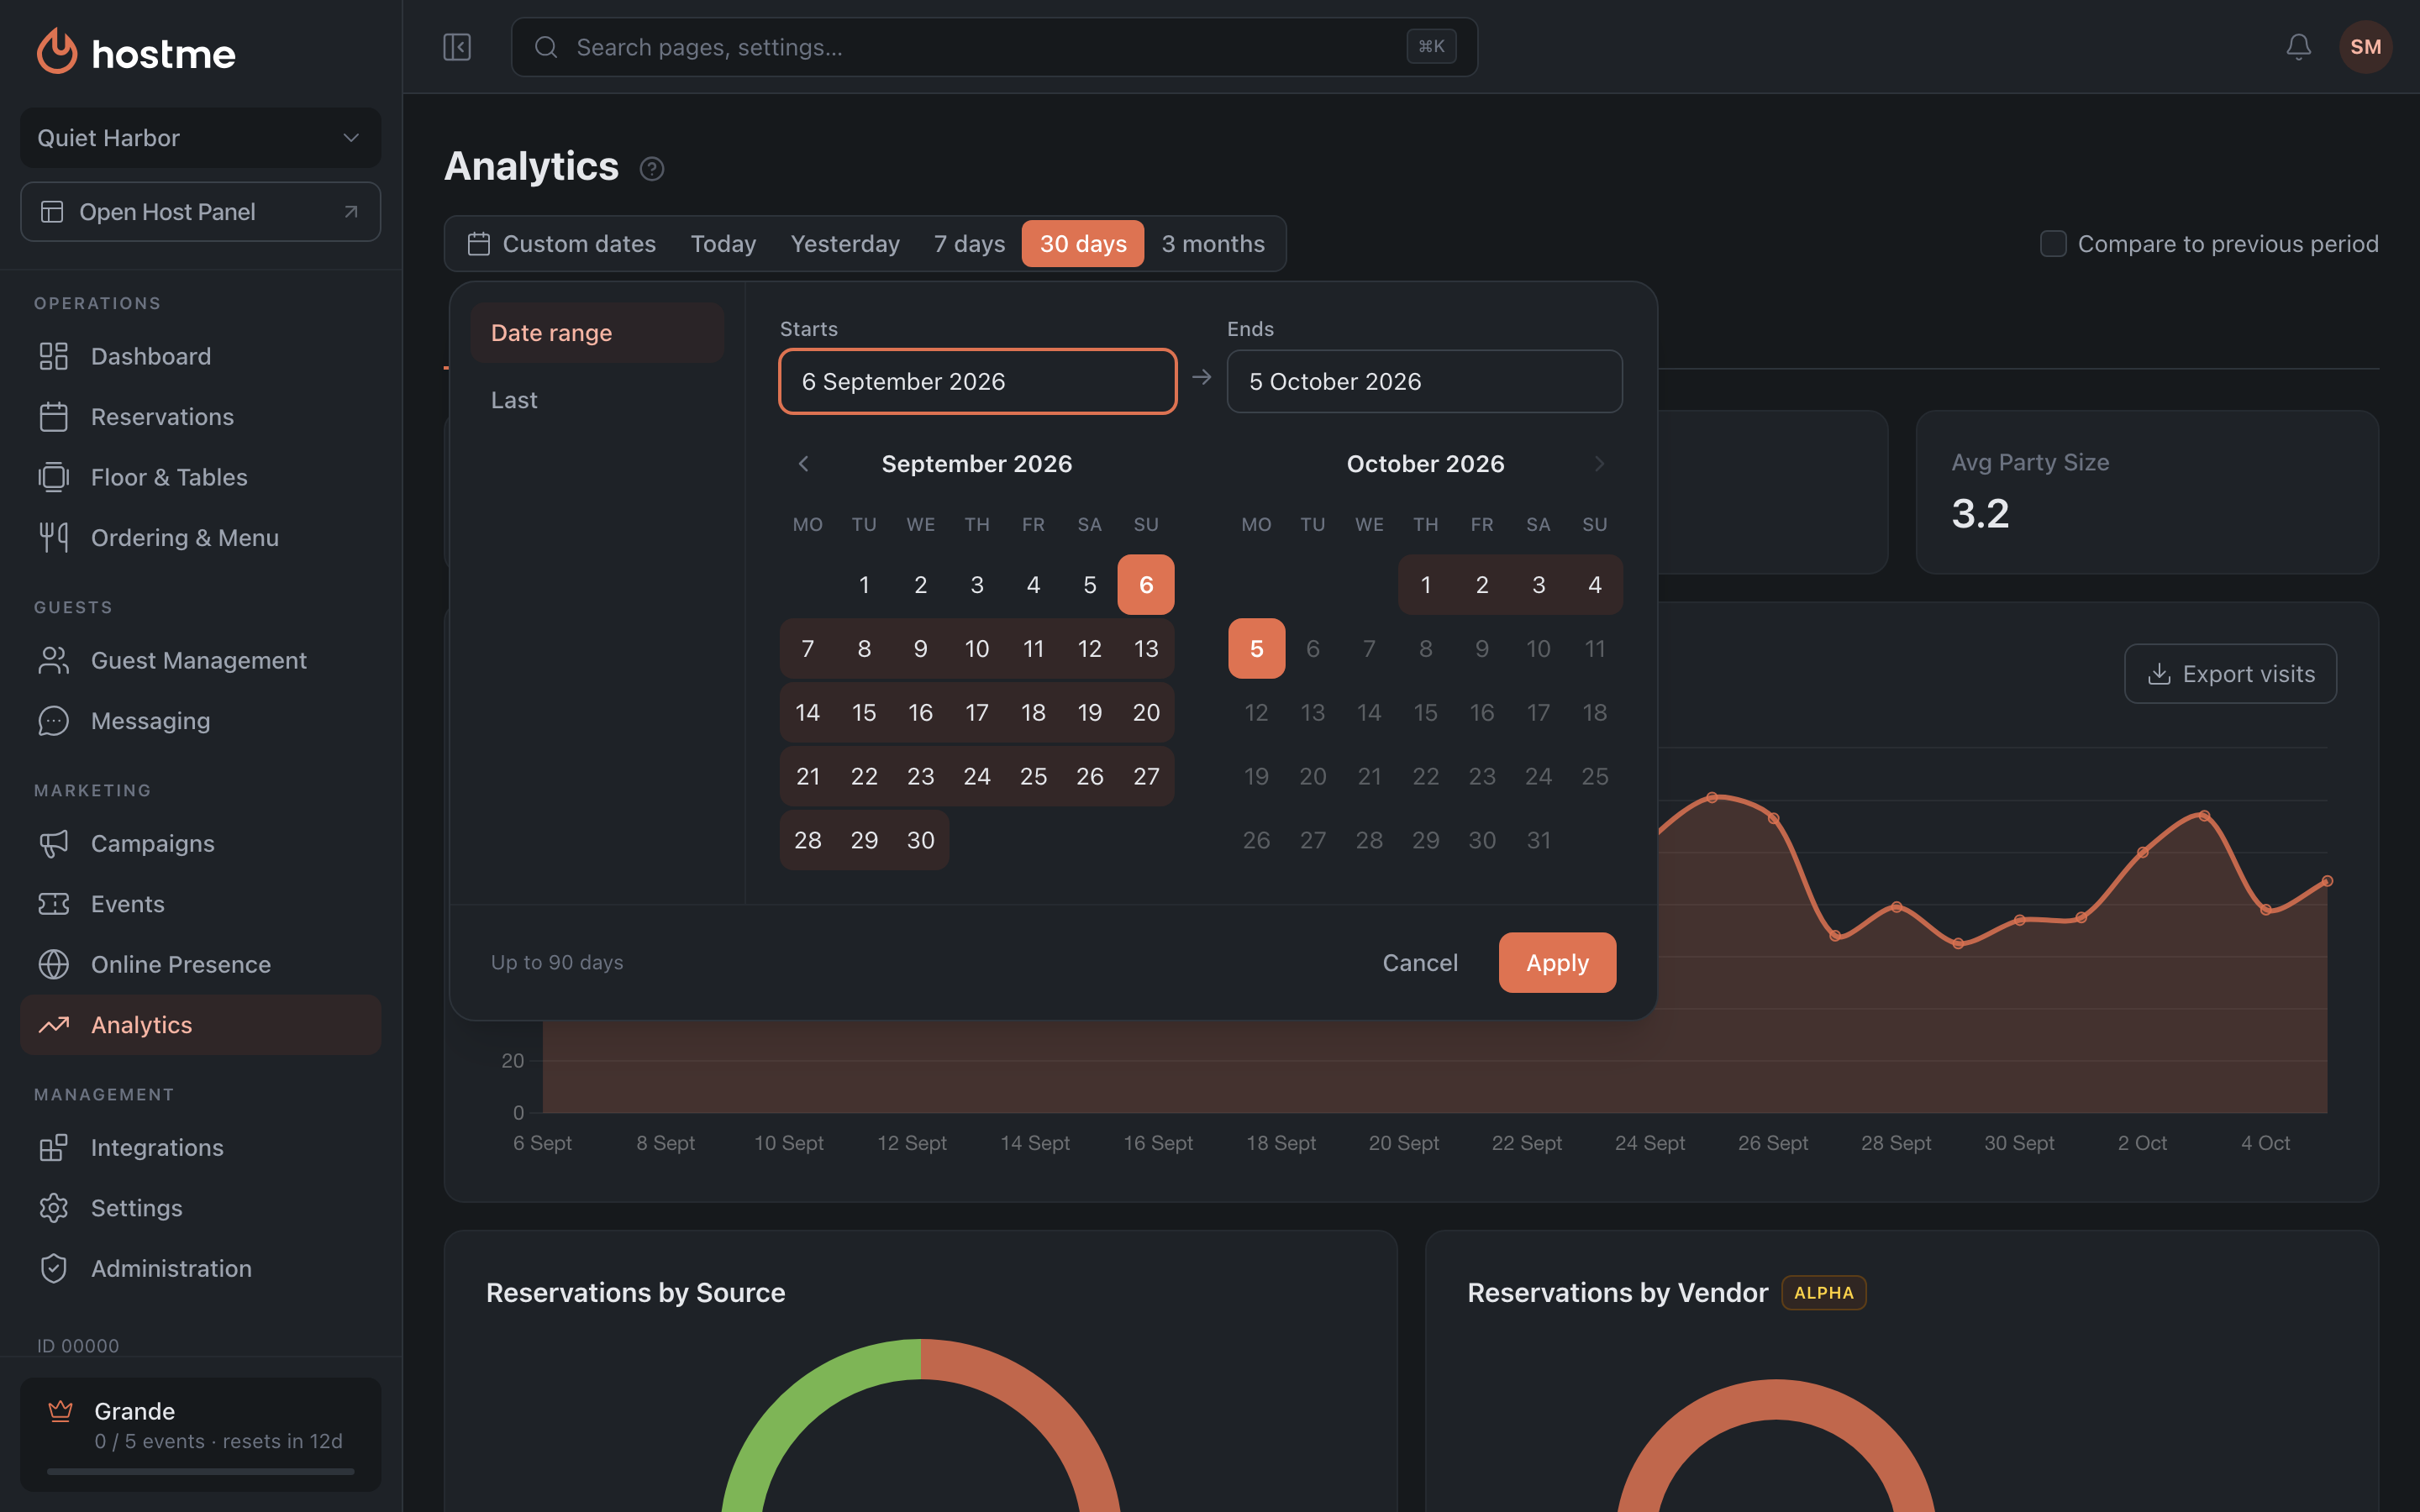
Next to it is the “Compare to previous period” checkbox: the charts get a dashed line and the cards show the difference from the previous period. Comparison is available for periods of up to 45 days.
If a single day is selected, the charts are drawn by hour.
Tabs
Each tab is a section of its own below — they can be linked to directly, including from the panel.
Overview
The key cards — Total Reservations, “Total Covers” (seatings for the period), No-show Rate, Avg Party Size — and charts: daily covers, reservations by source (online/host), reservations by status, online requests (if manual booking approval is enabled).
Separately there is the “Reservations by Vendor” pie chart: the split of online bookings across partner networks (Google and others). It is in alpha.
Reservations
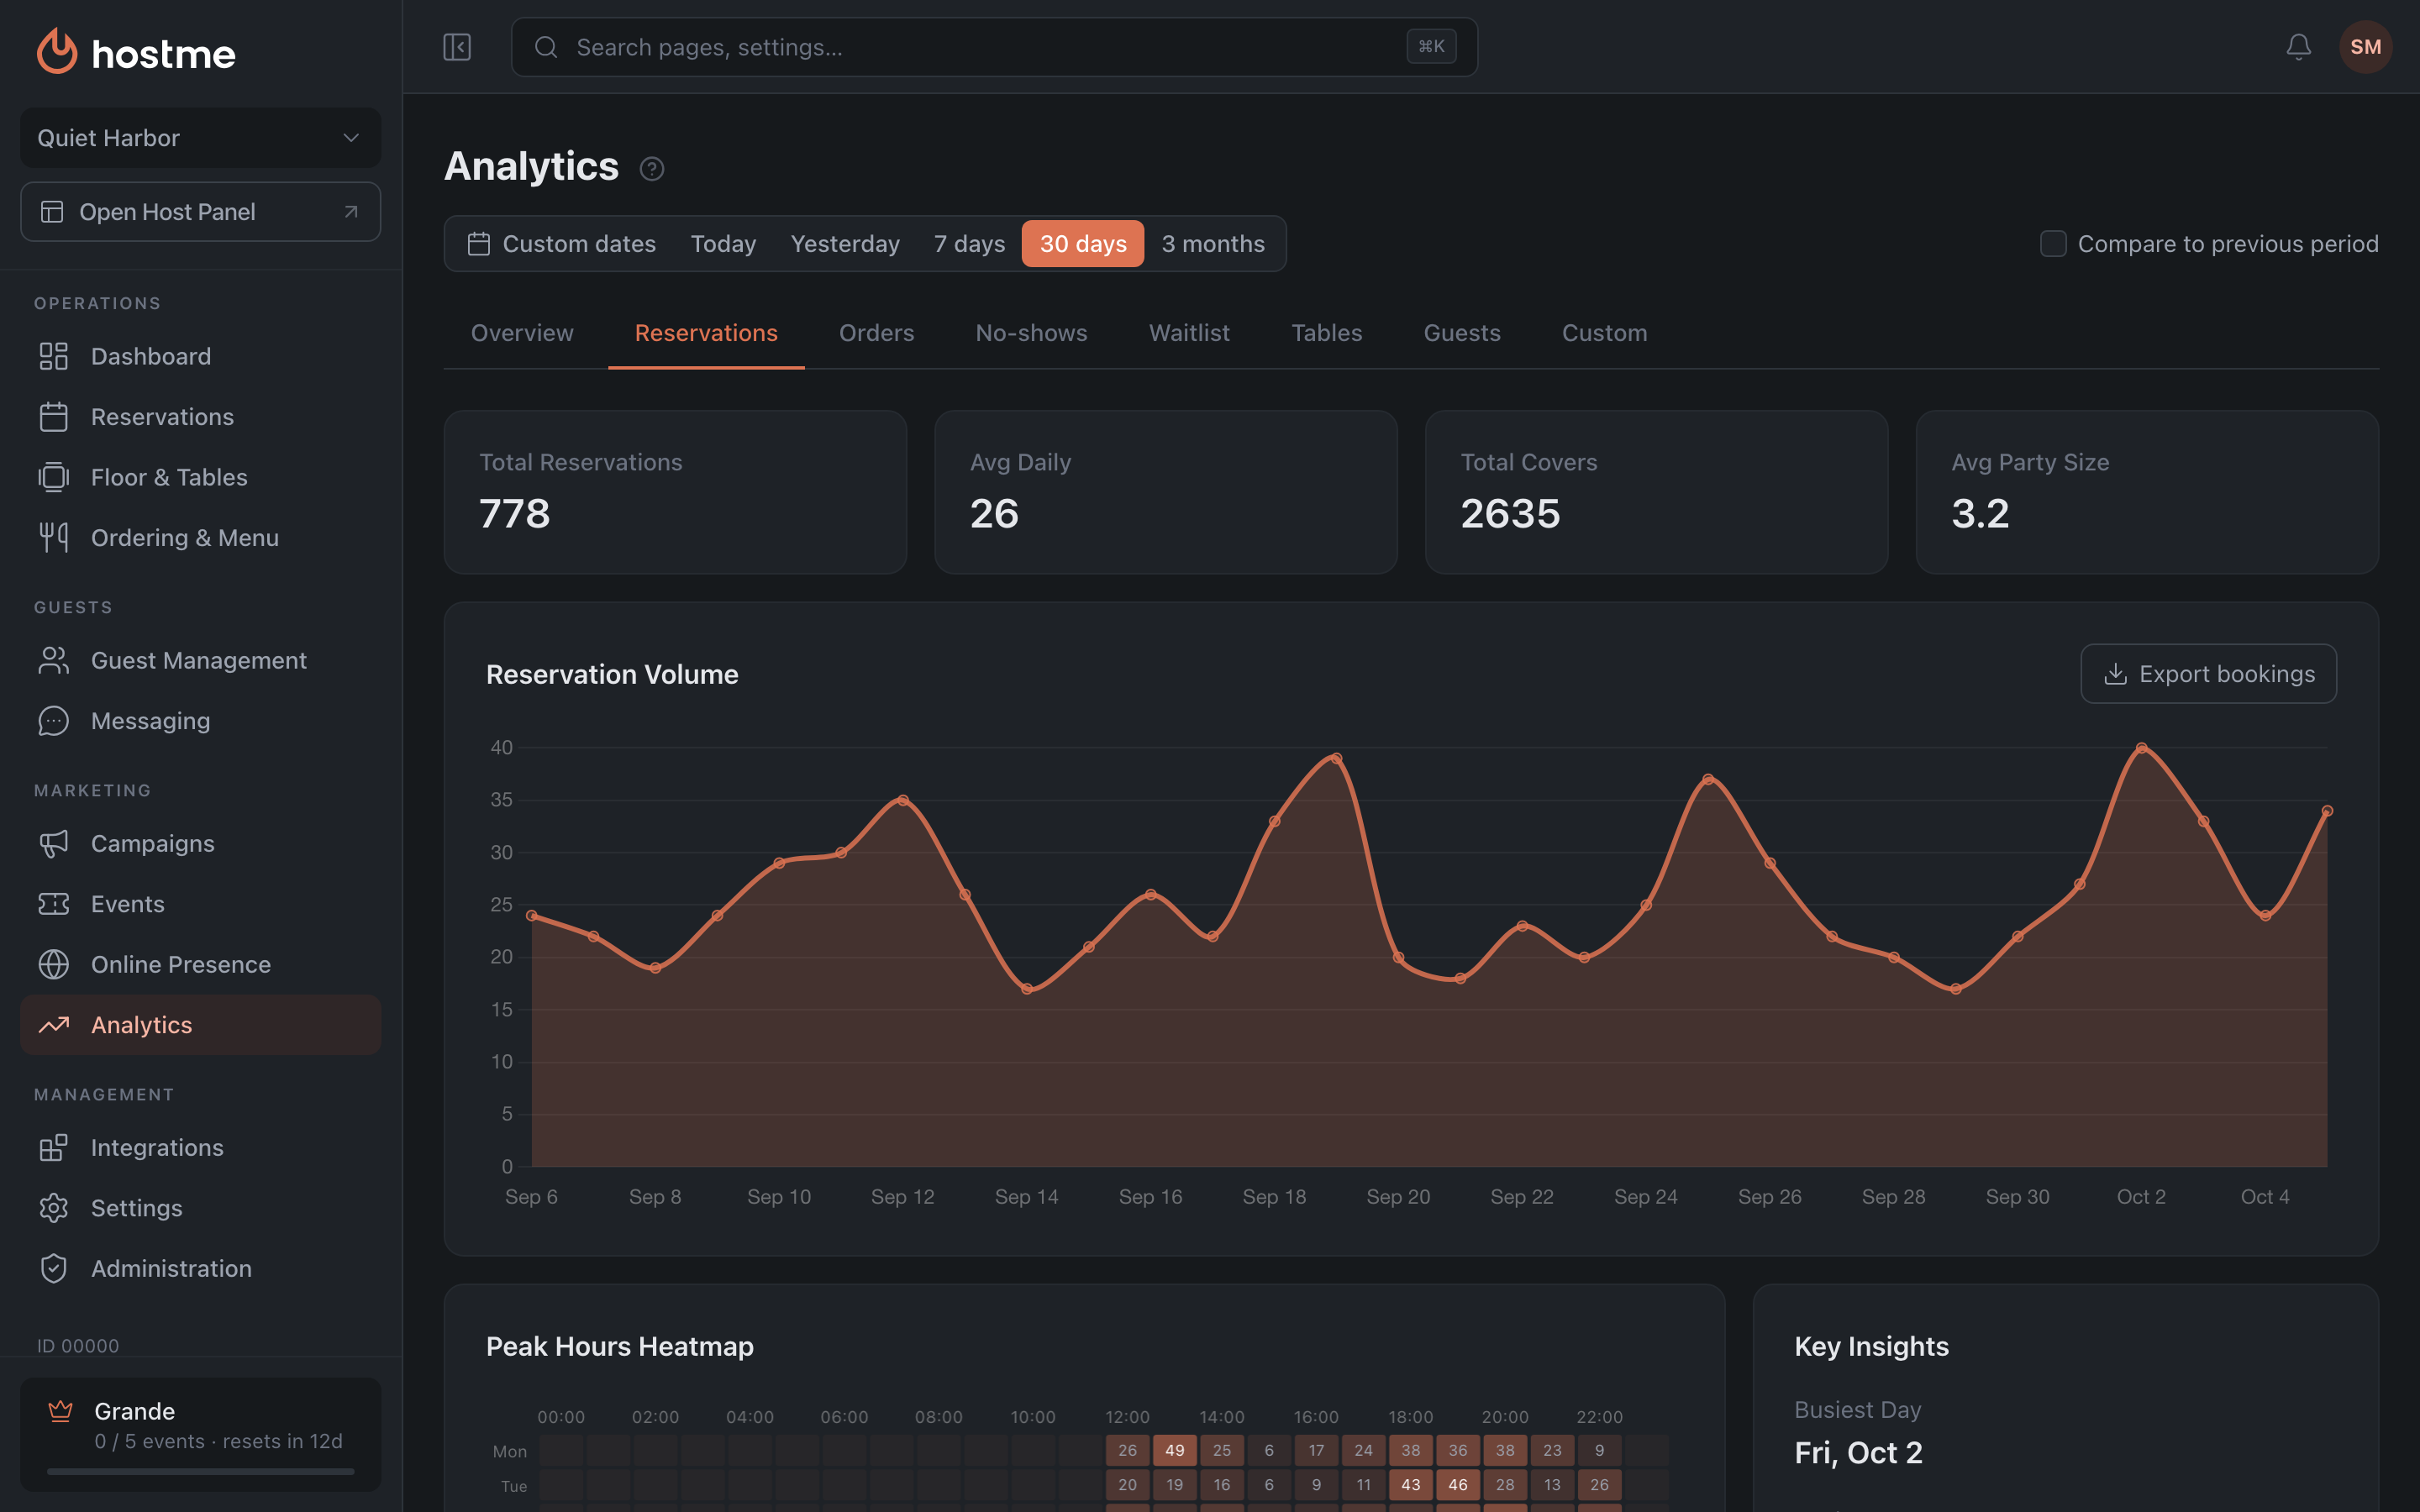
Reservation volume, peak hours (a heatmap), key insights. The heatmap answers when to put more staff on, and which hours are worth capping the flow of bookings.
Orders
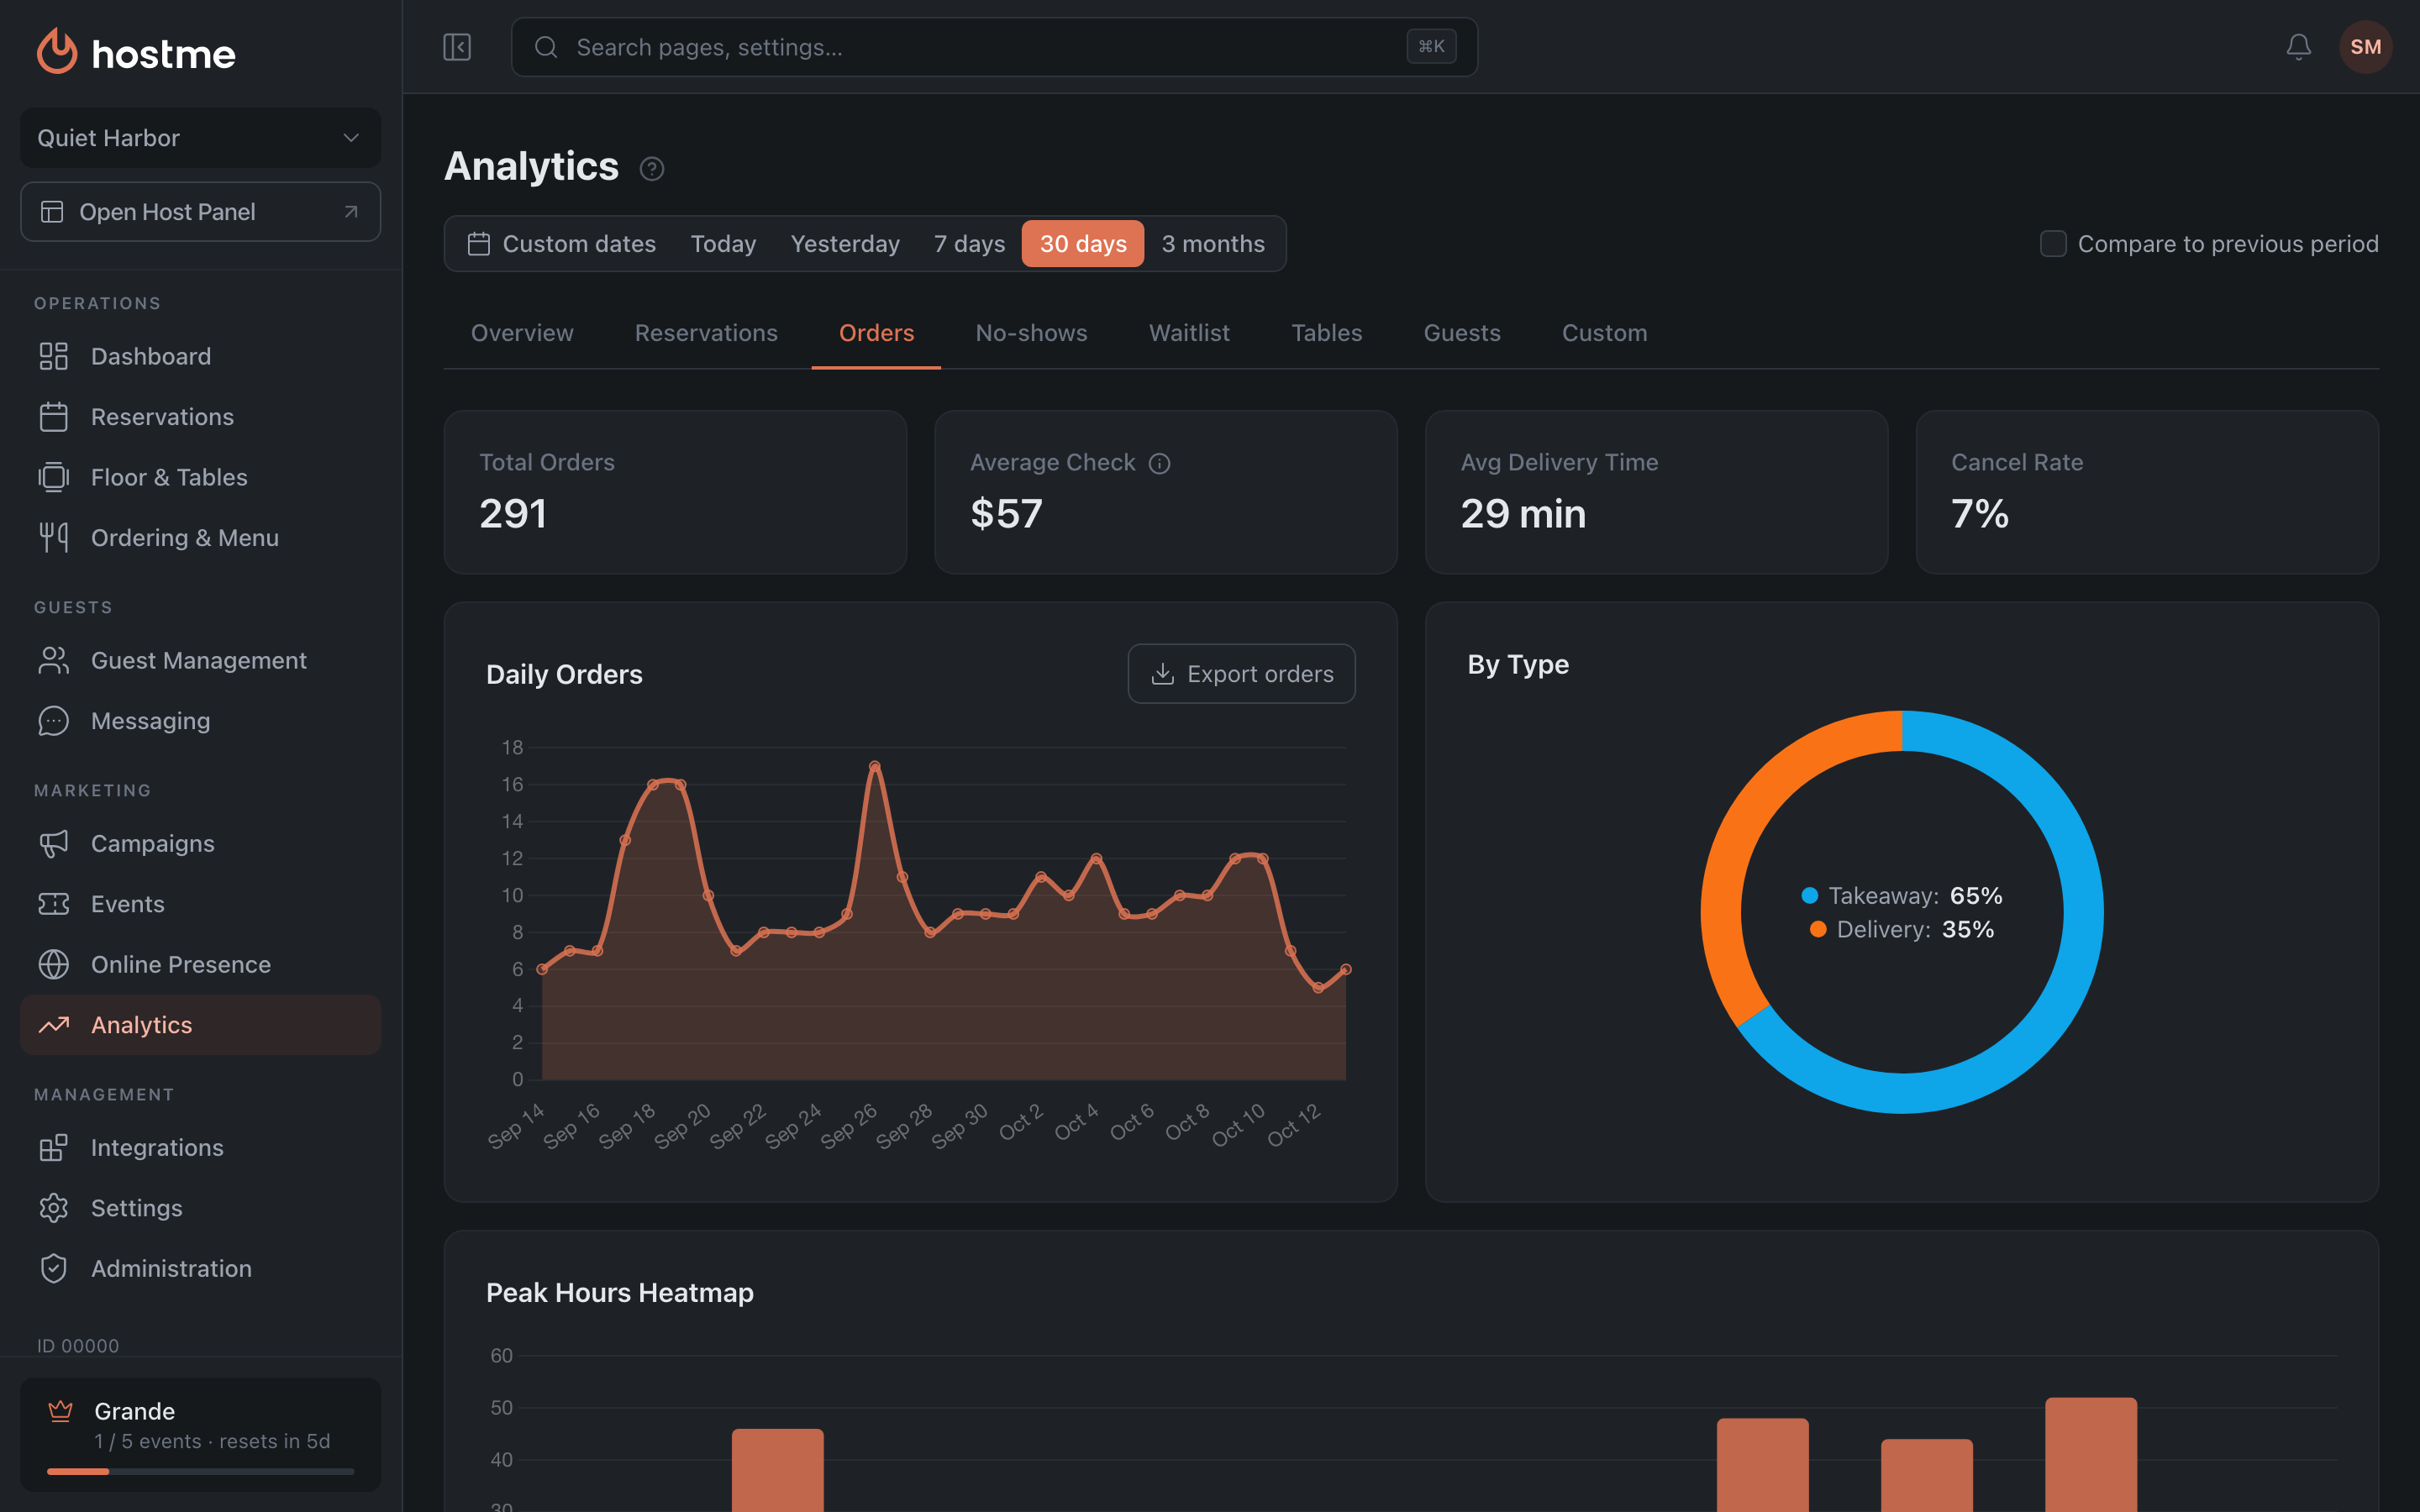
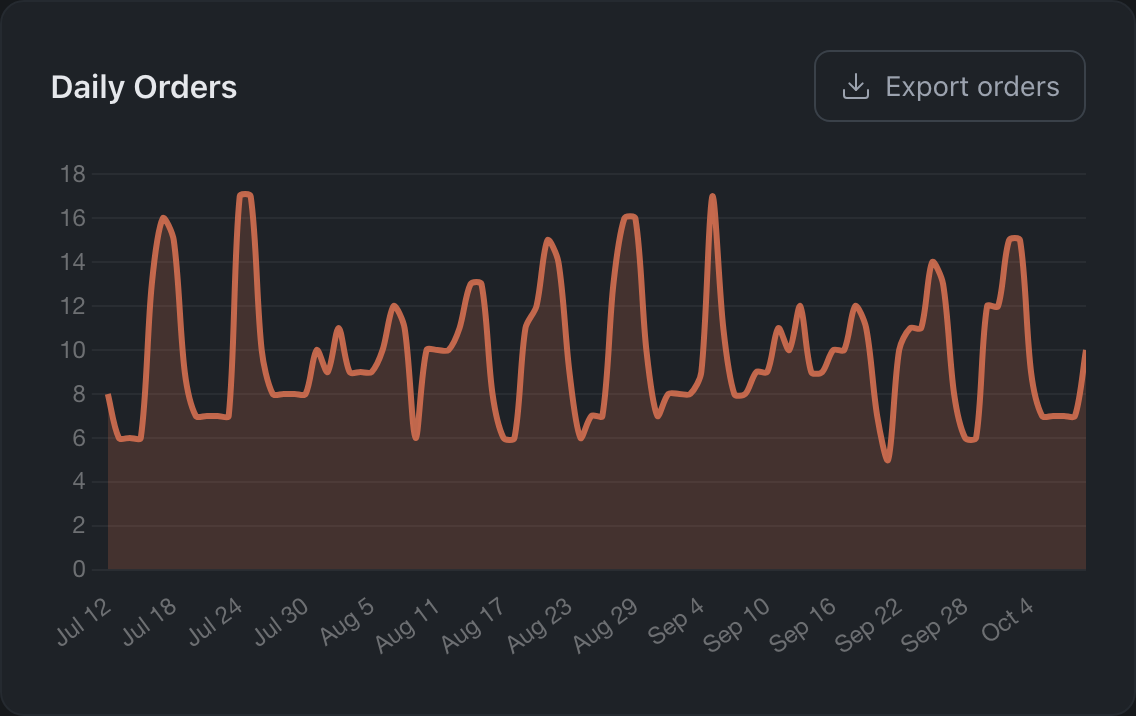
Delivery and takeaway orders: total orders, average check, average delivery time, cancel rate.
- Average Check — the sum of the dishes, excluding delivery and tips; orders of 0 aren’t counted.
- Avg Delivery Time — deliveries only: from when the order is set to “Out for delivery” in the host panel to when it is closed. If deliveries aren’t set to “Out for delivery” and closed, you’ll see a dash.
A rising delivery time together with a rising cancel rate usually means the kitchen is not keeping up at peak.
No-shows
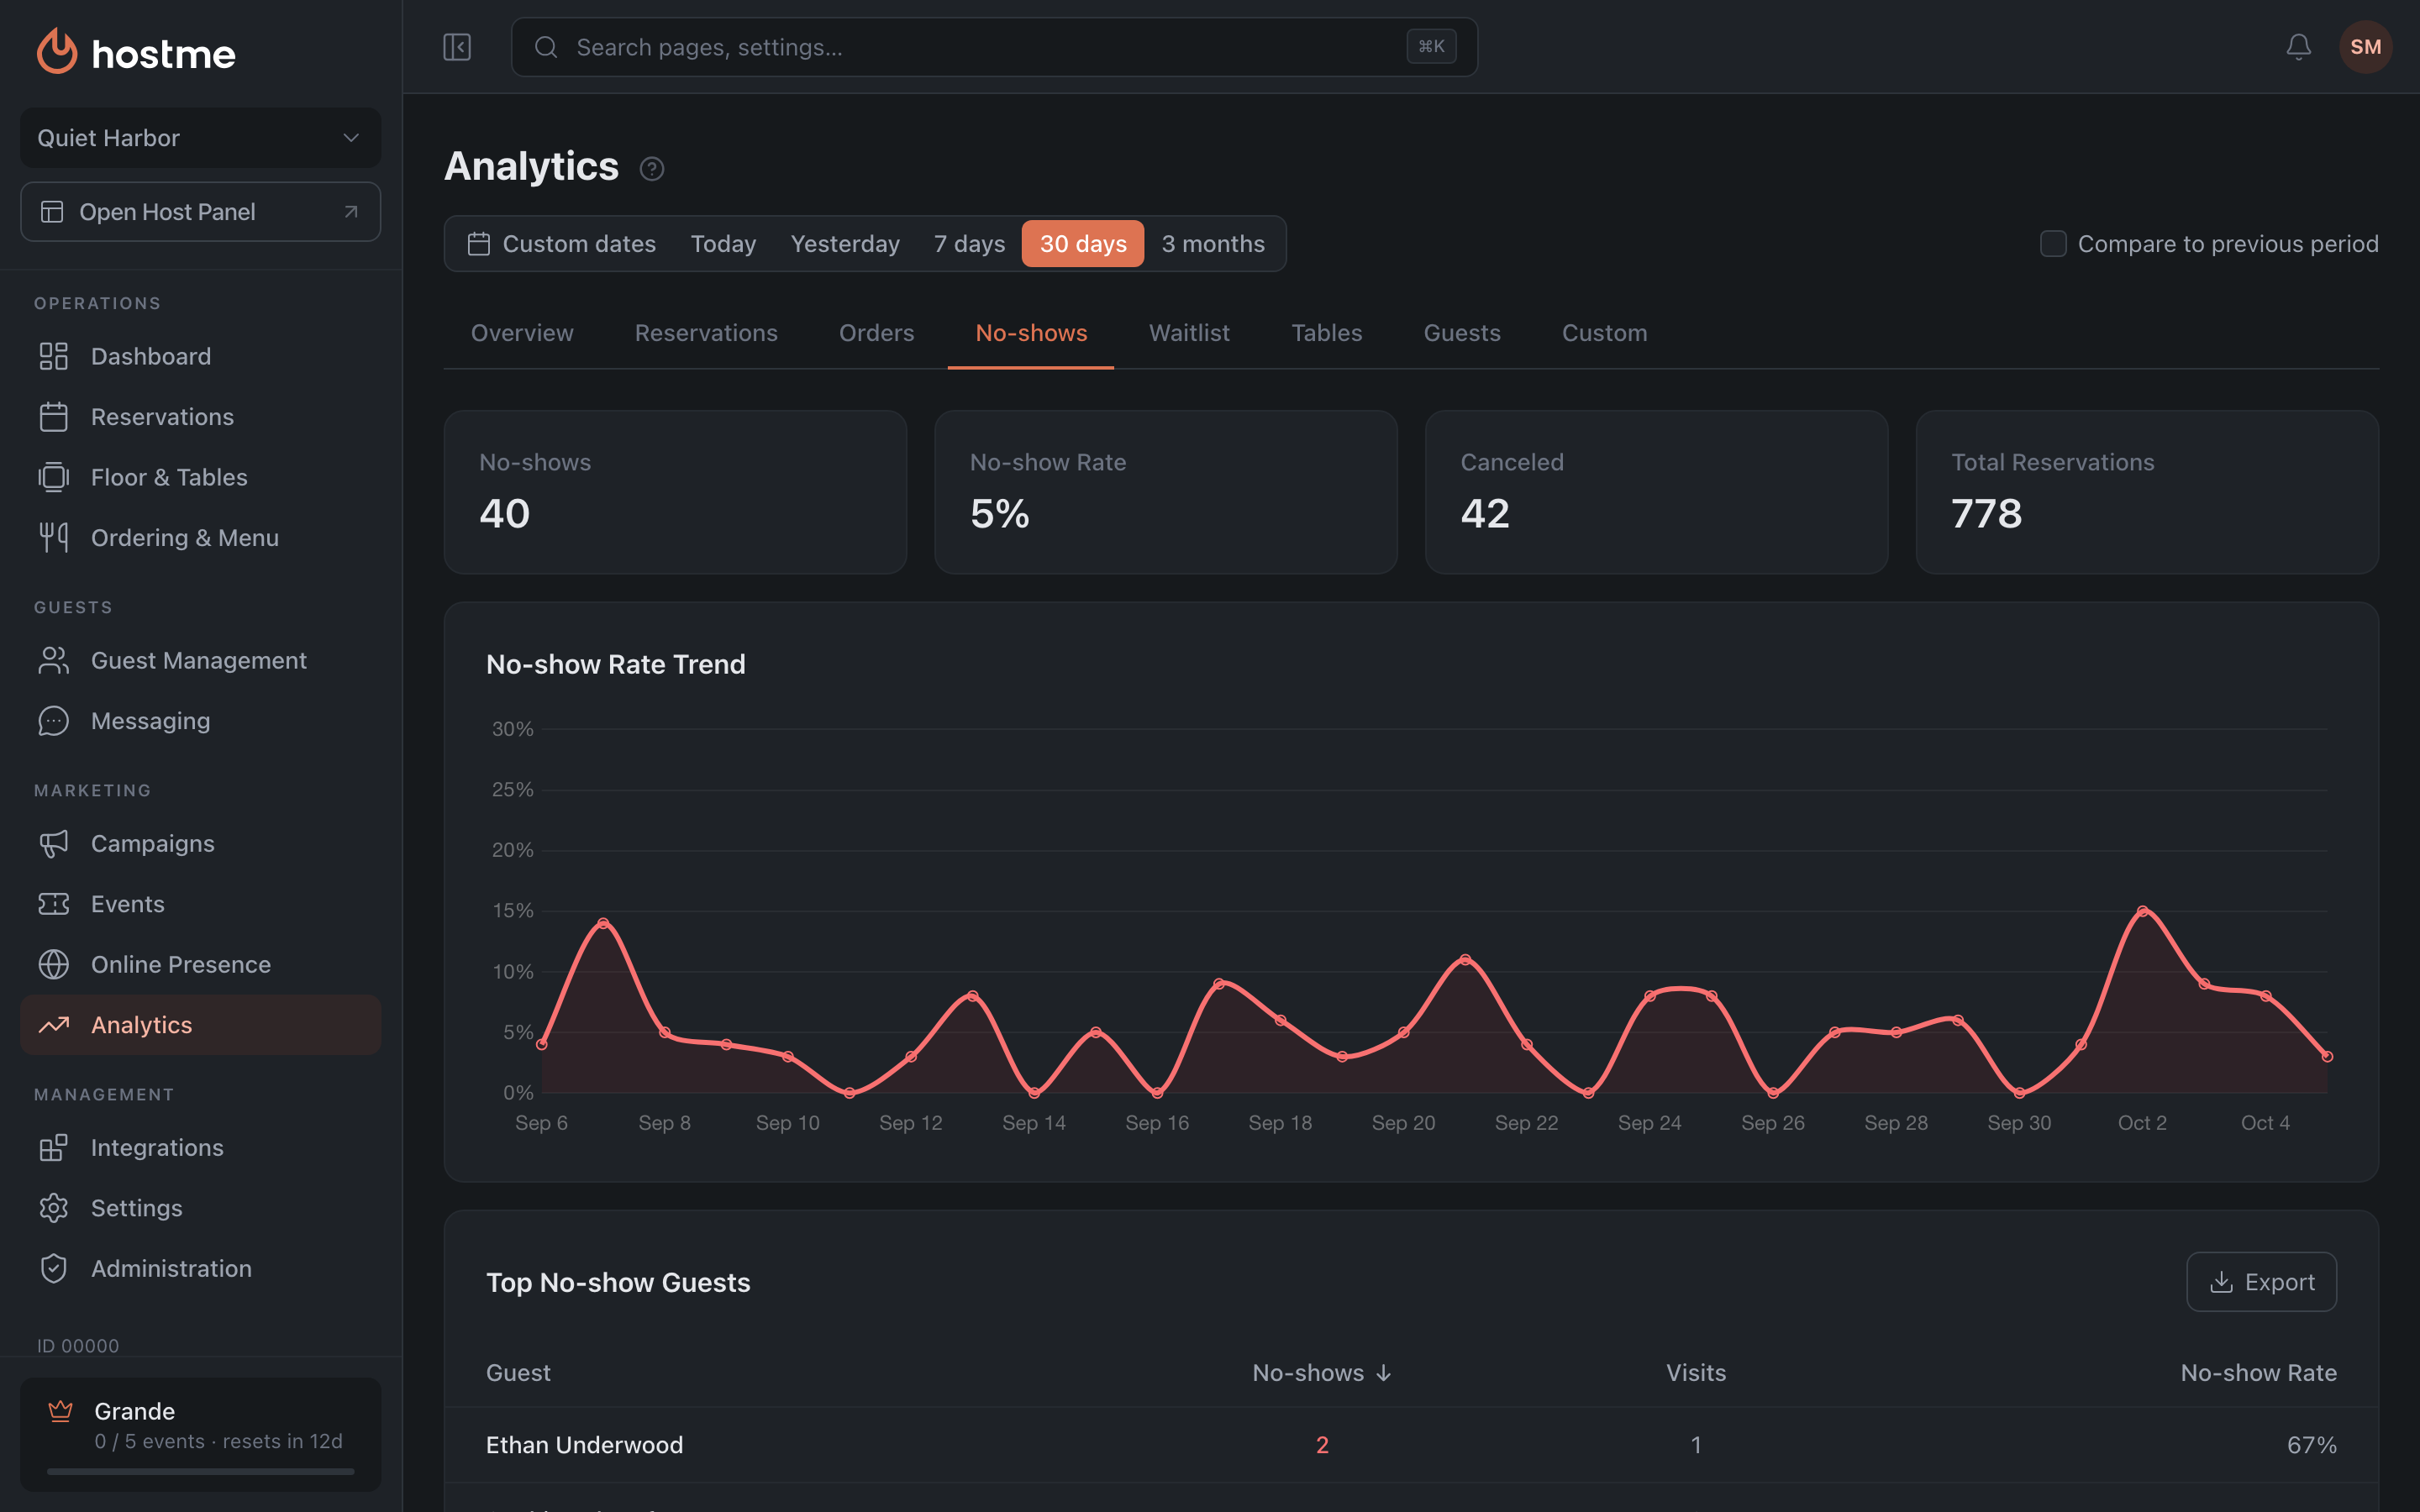
The no-show trend and the “Top No-show Guests” table (with export); clicking a row opens the guest profile. This is where you decide whether to turn on deposits or reminders: a handful of repeat offenders is dealt with one by one, no-shows spread evenly across guests need a rule.
Waitlist
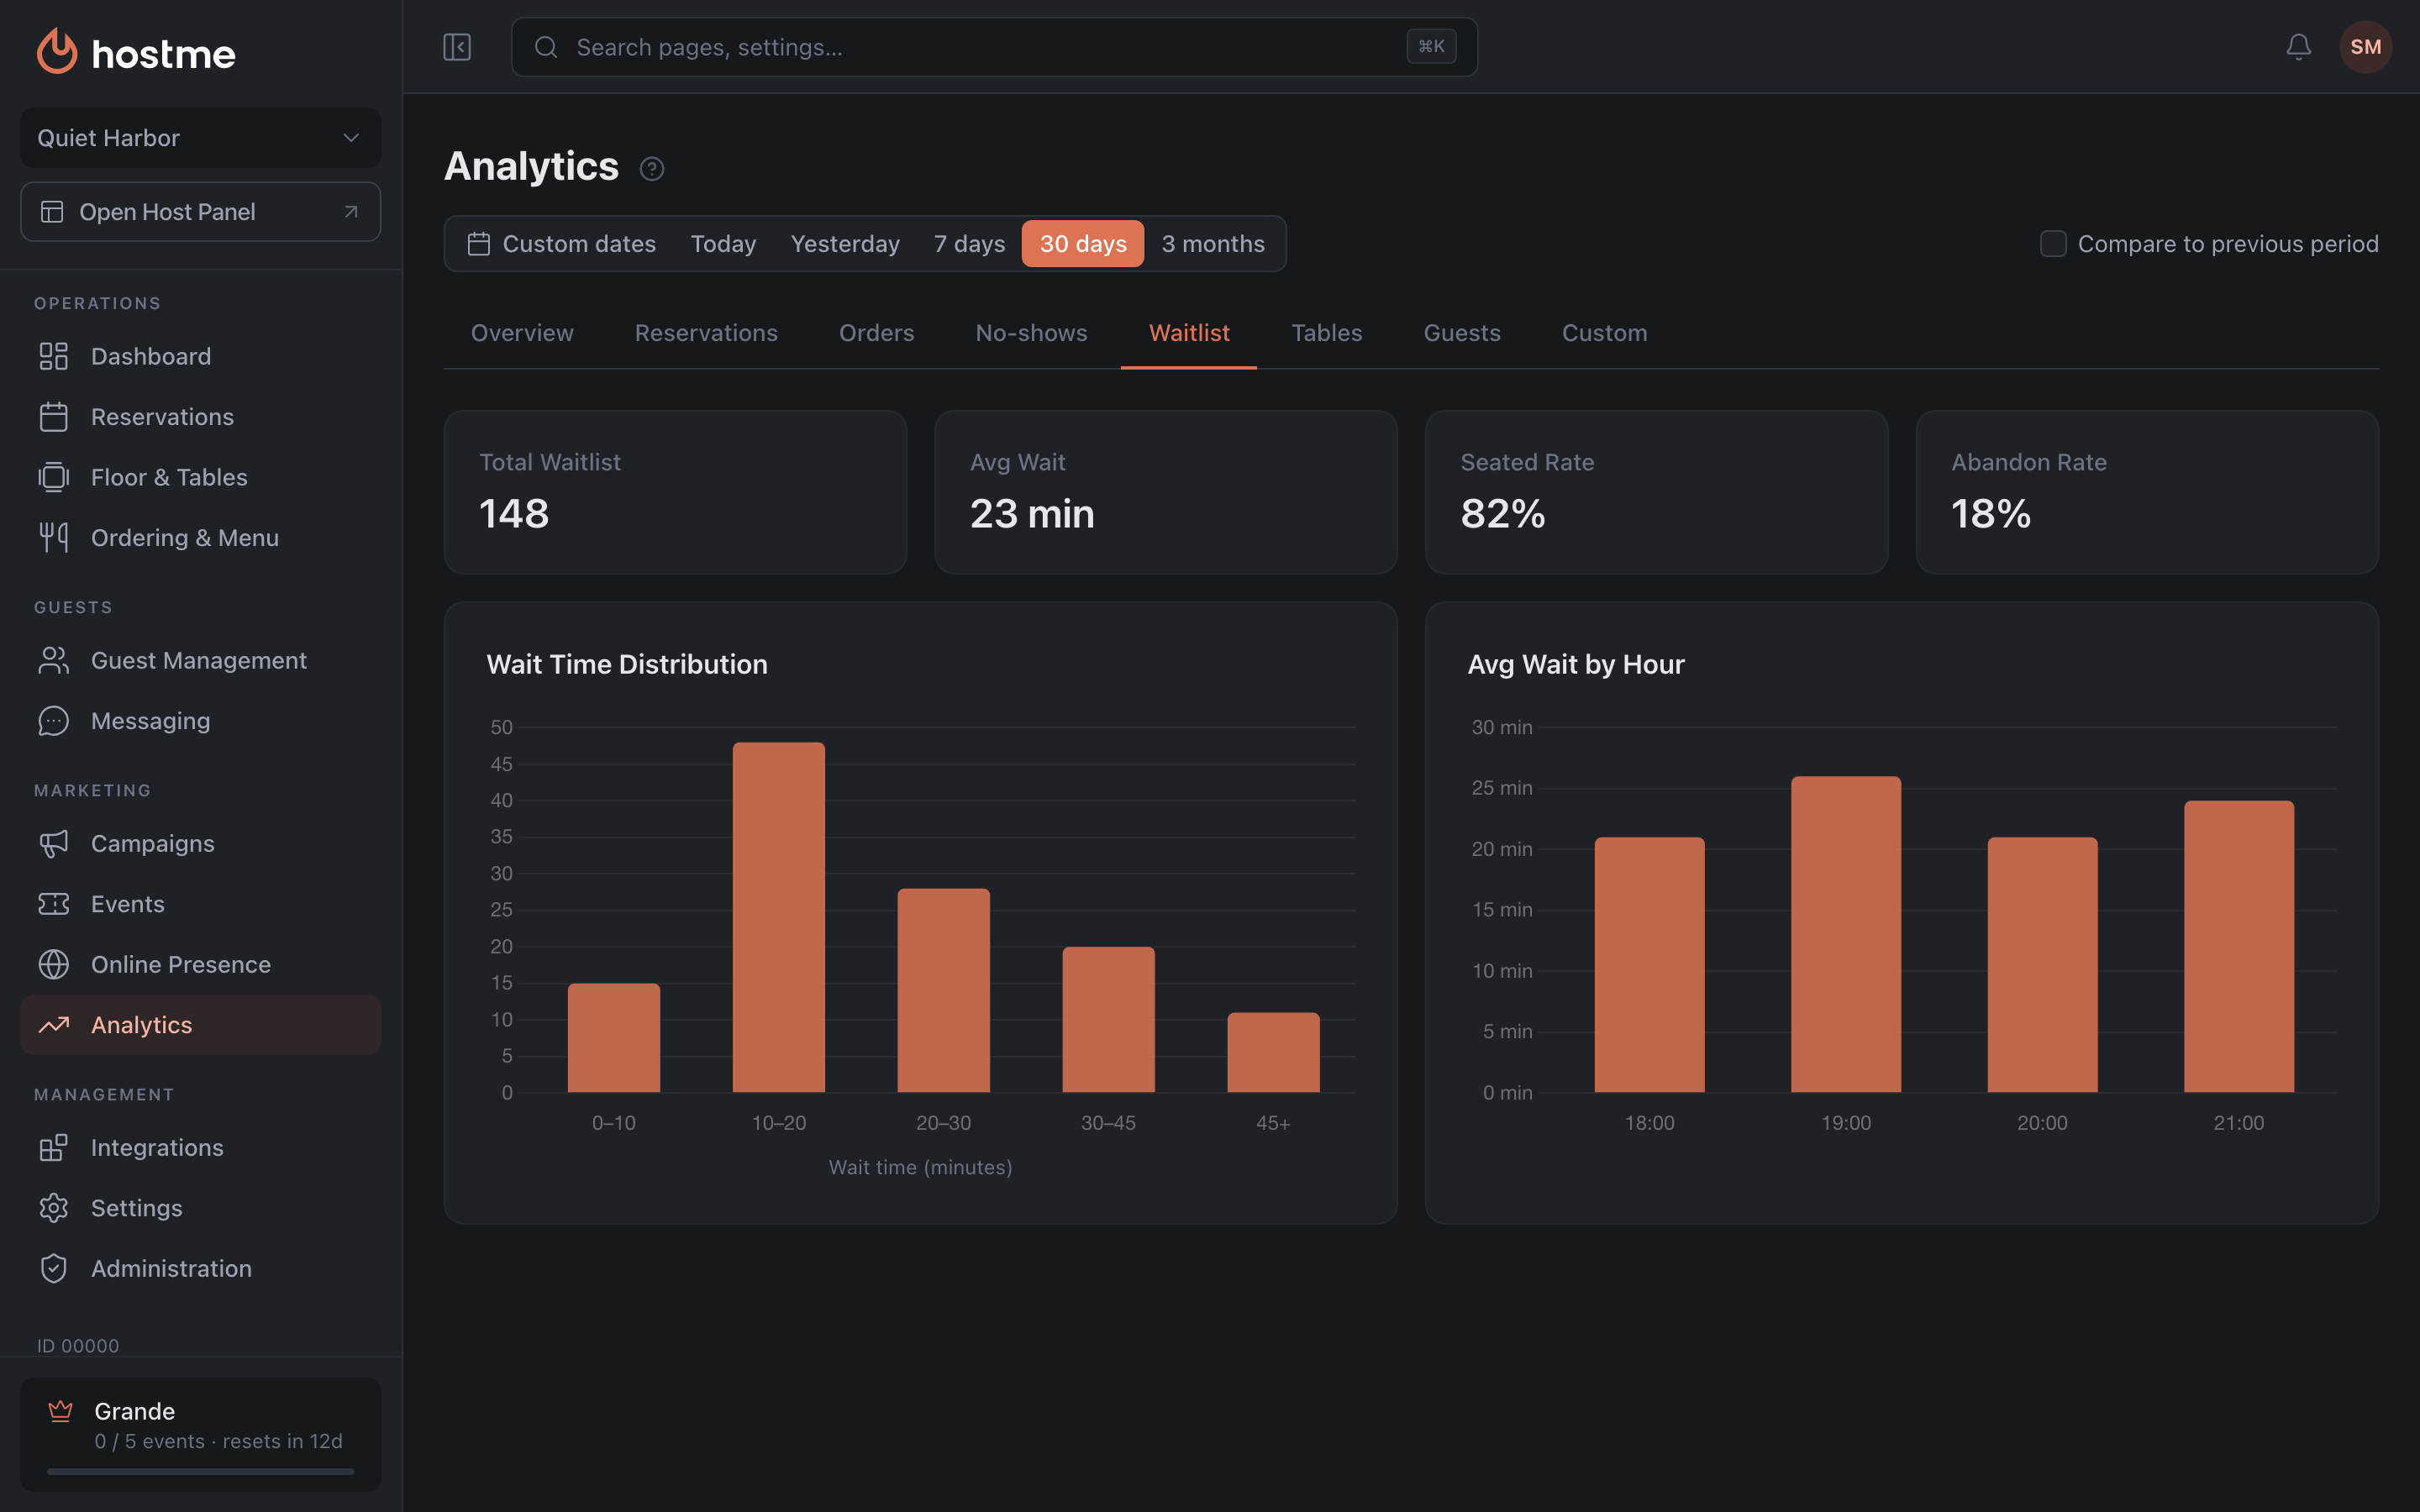
Waitlist metrics: total waitlist, average wait, seated and abandon rates, plus charts of wait time distribution and average wait by hour. The abandon rate shows how much revenue is lost at the door, and the by-hour chart shows exactly when.
Tables
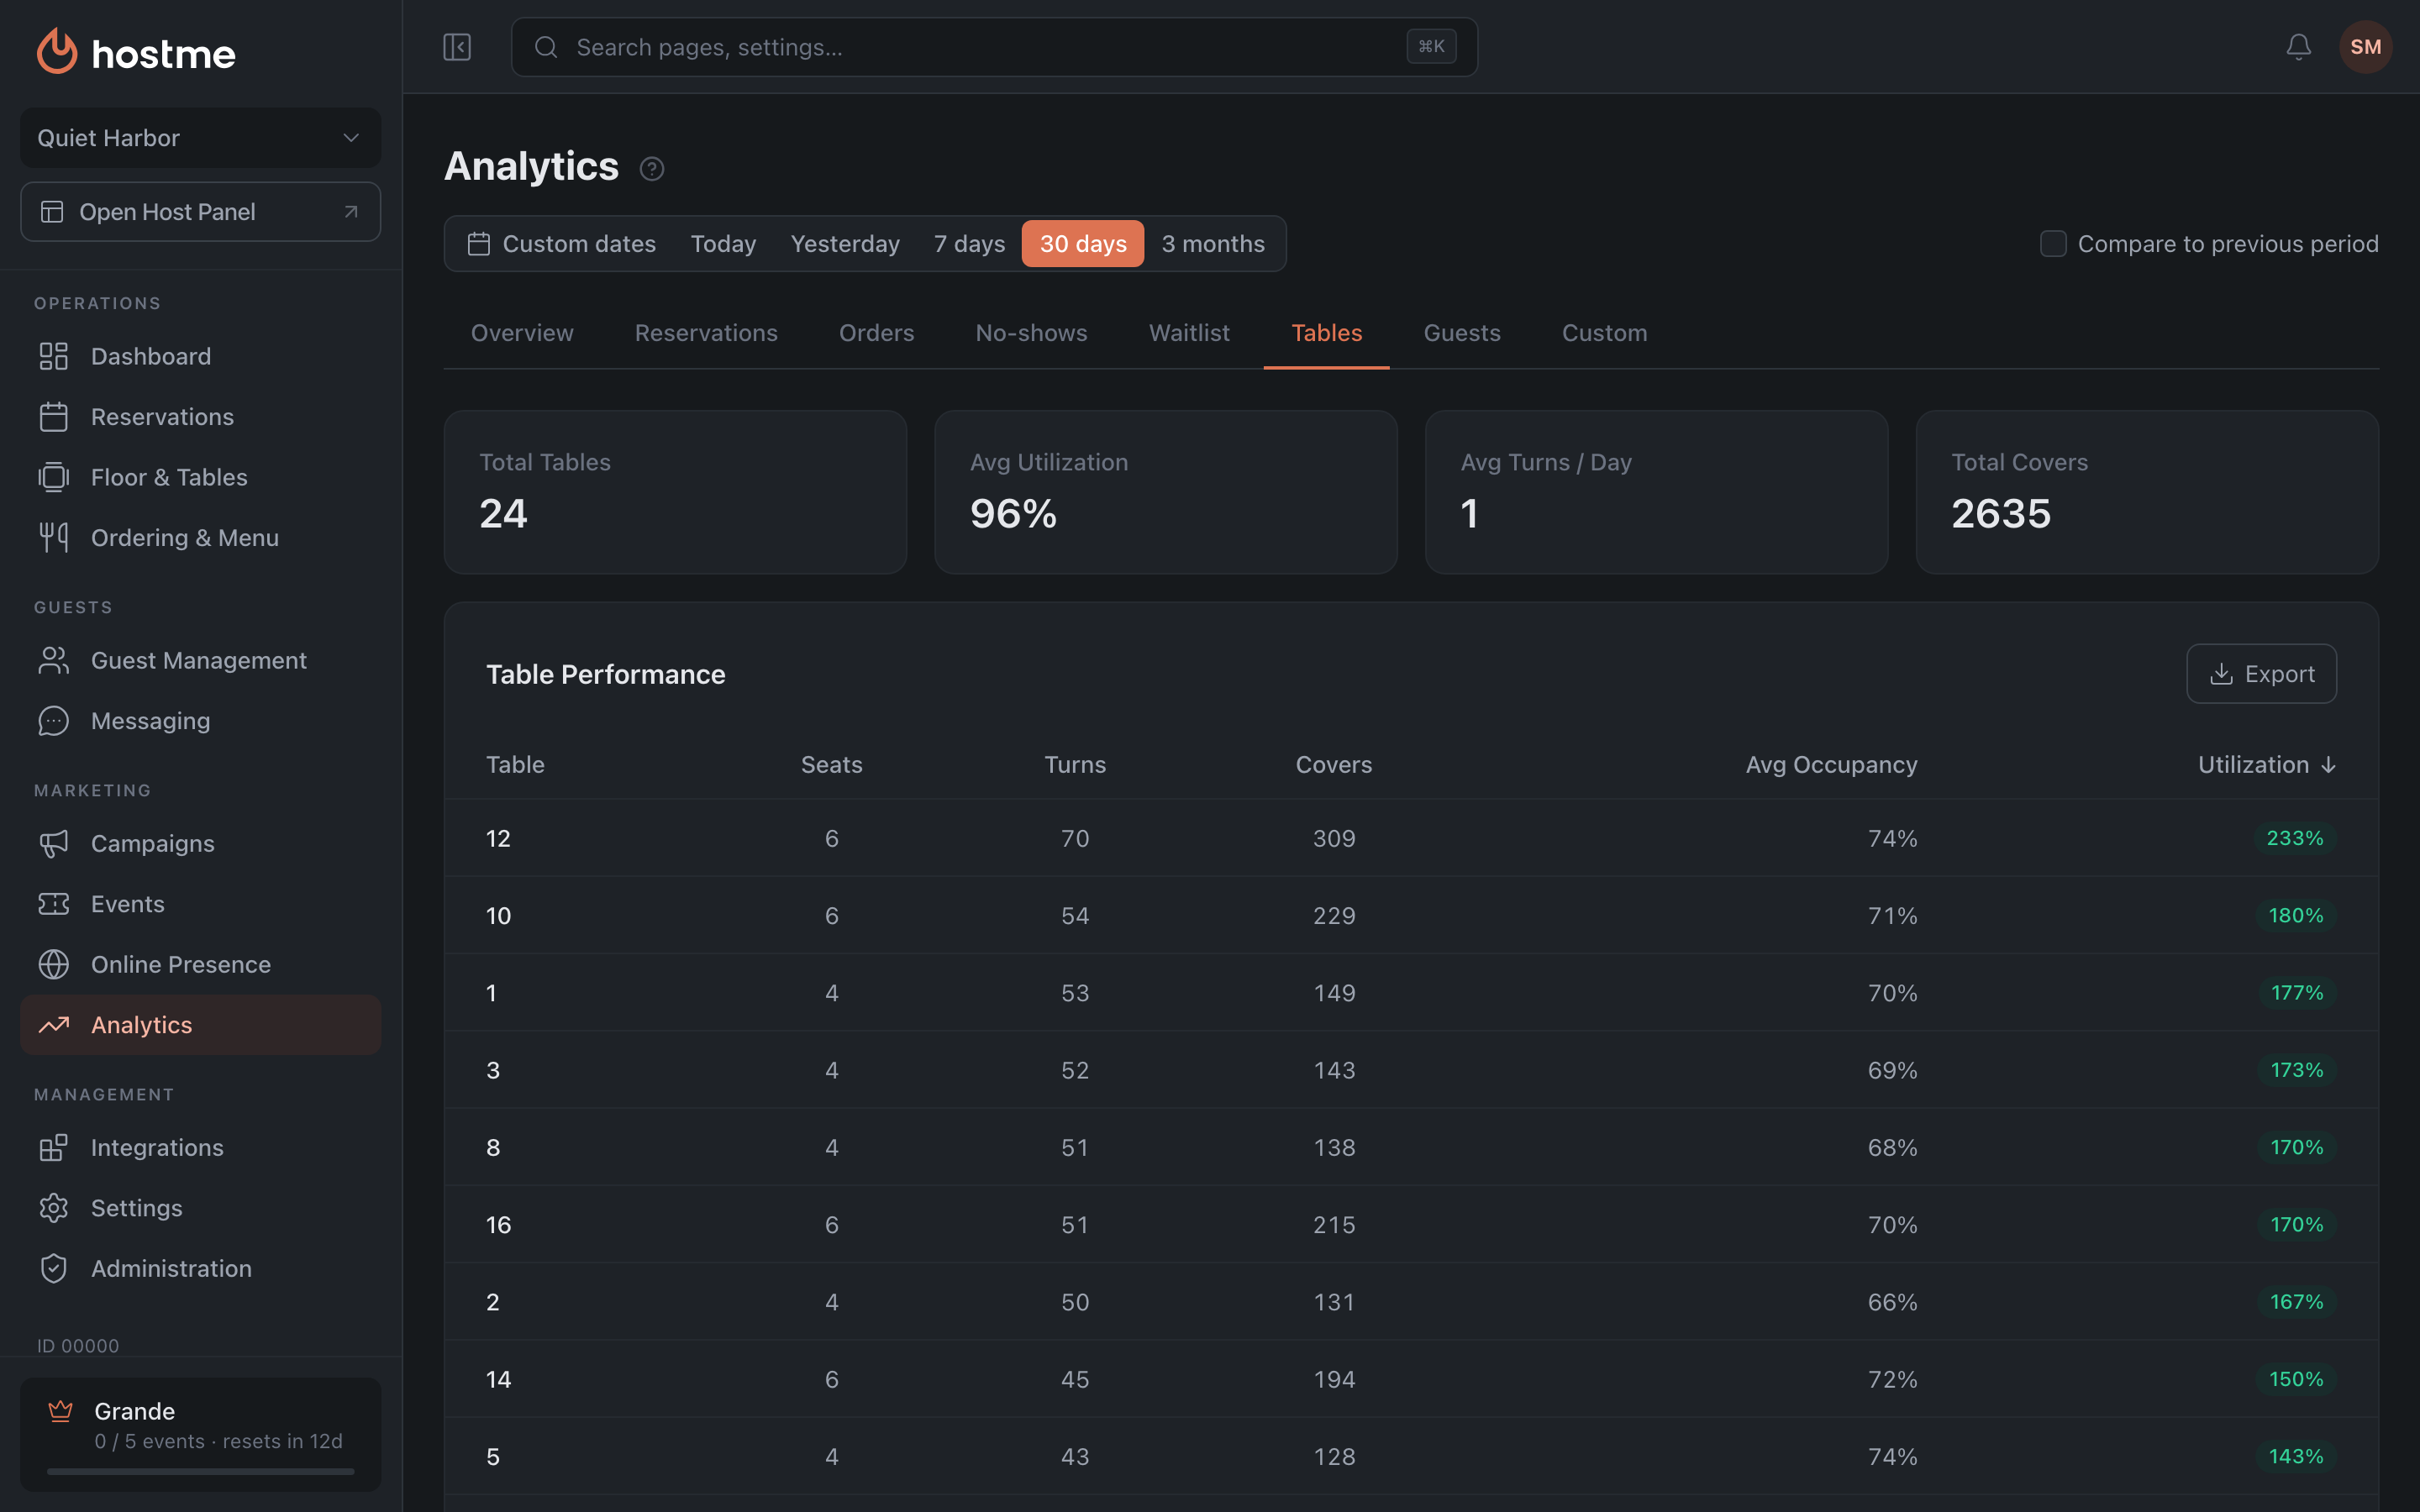
Table utilization and turns, the “Table Performance” table (with export). It helps find the tables that sit idle and decide whether their capacity or placement should change.
Guests
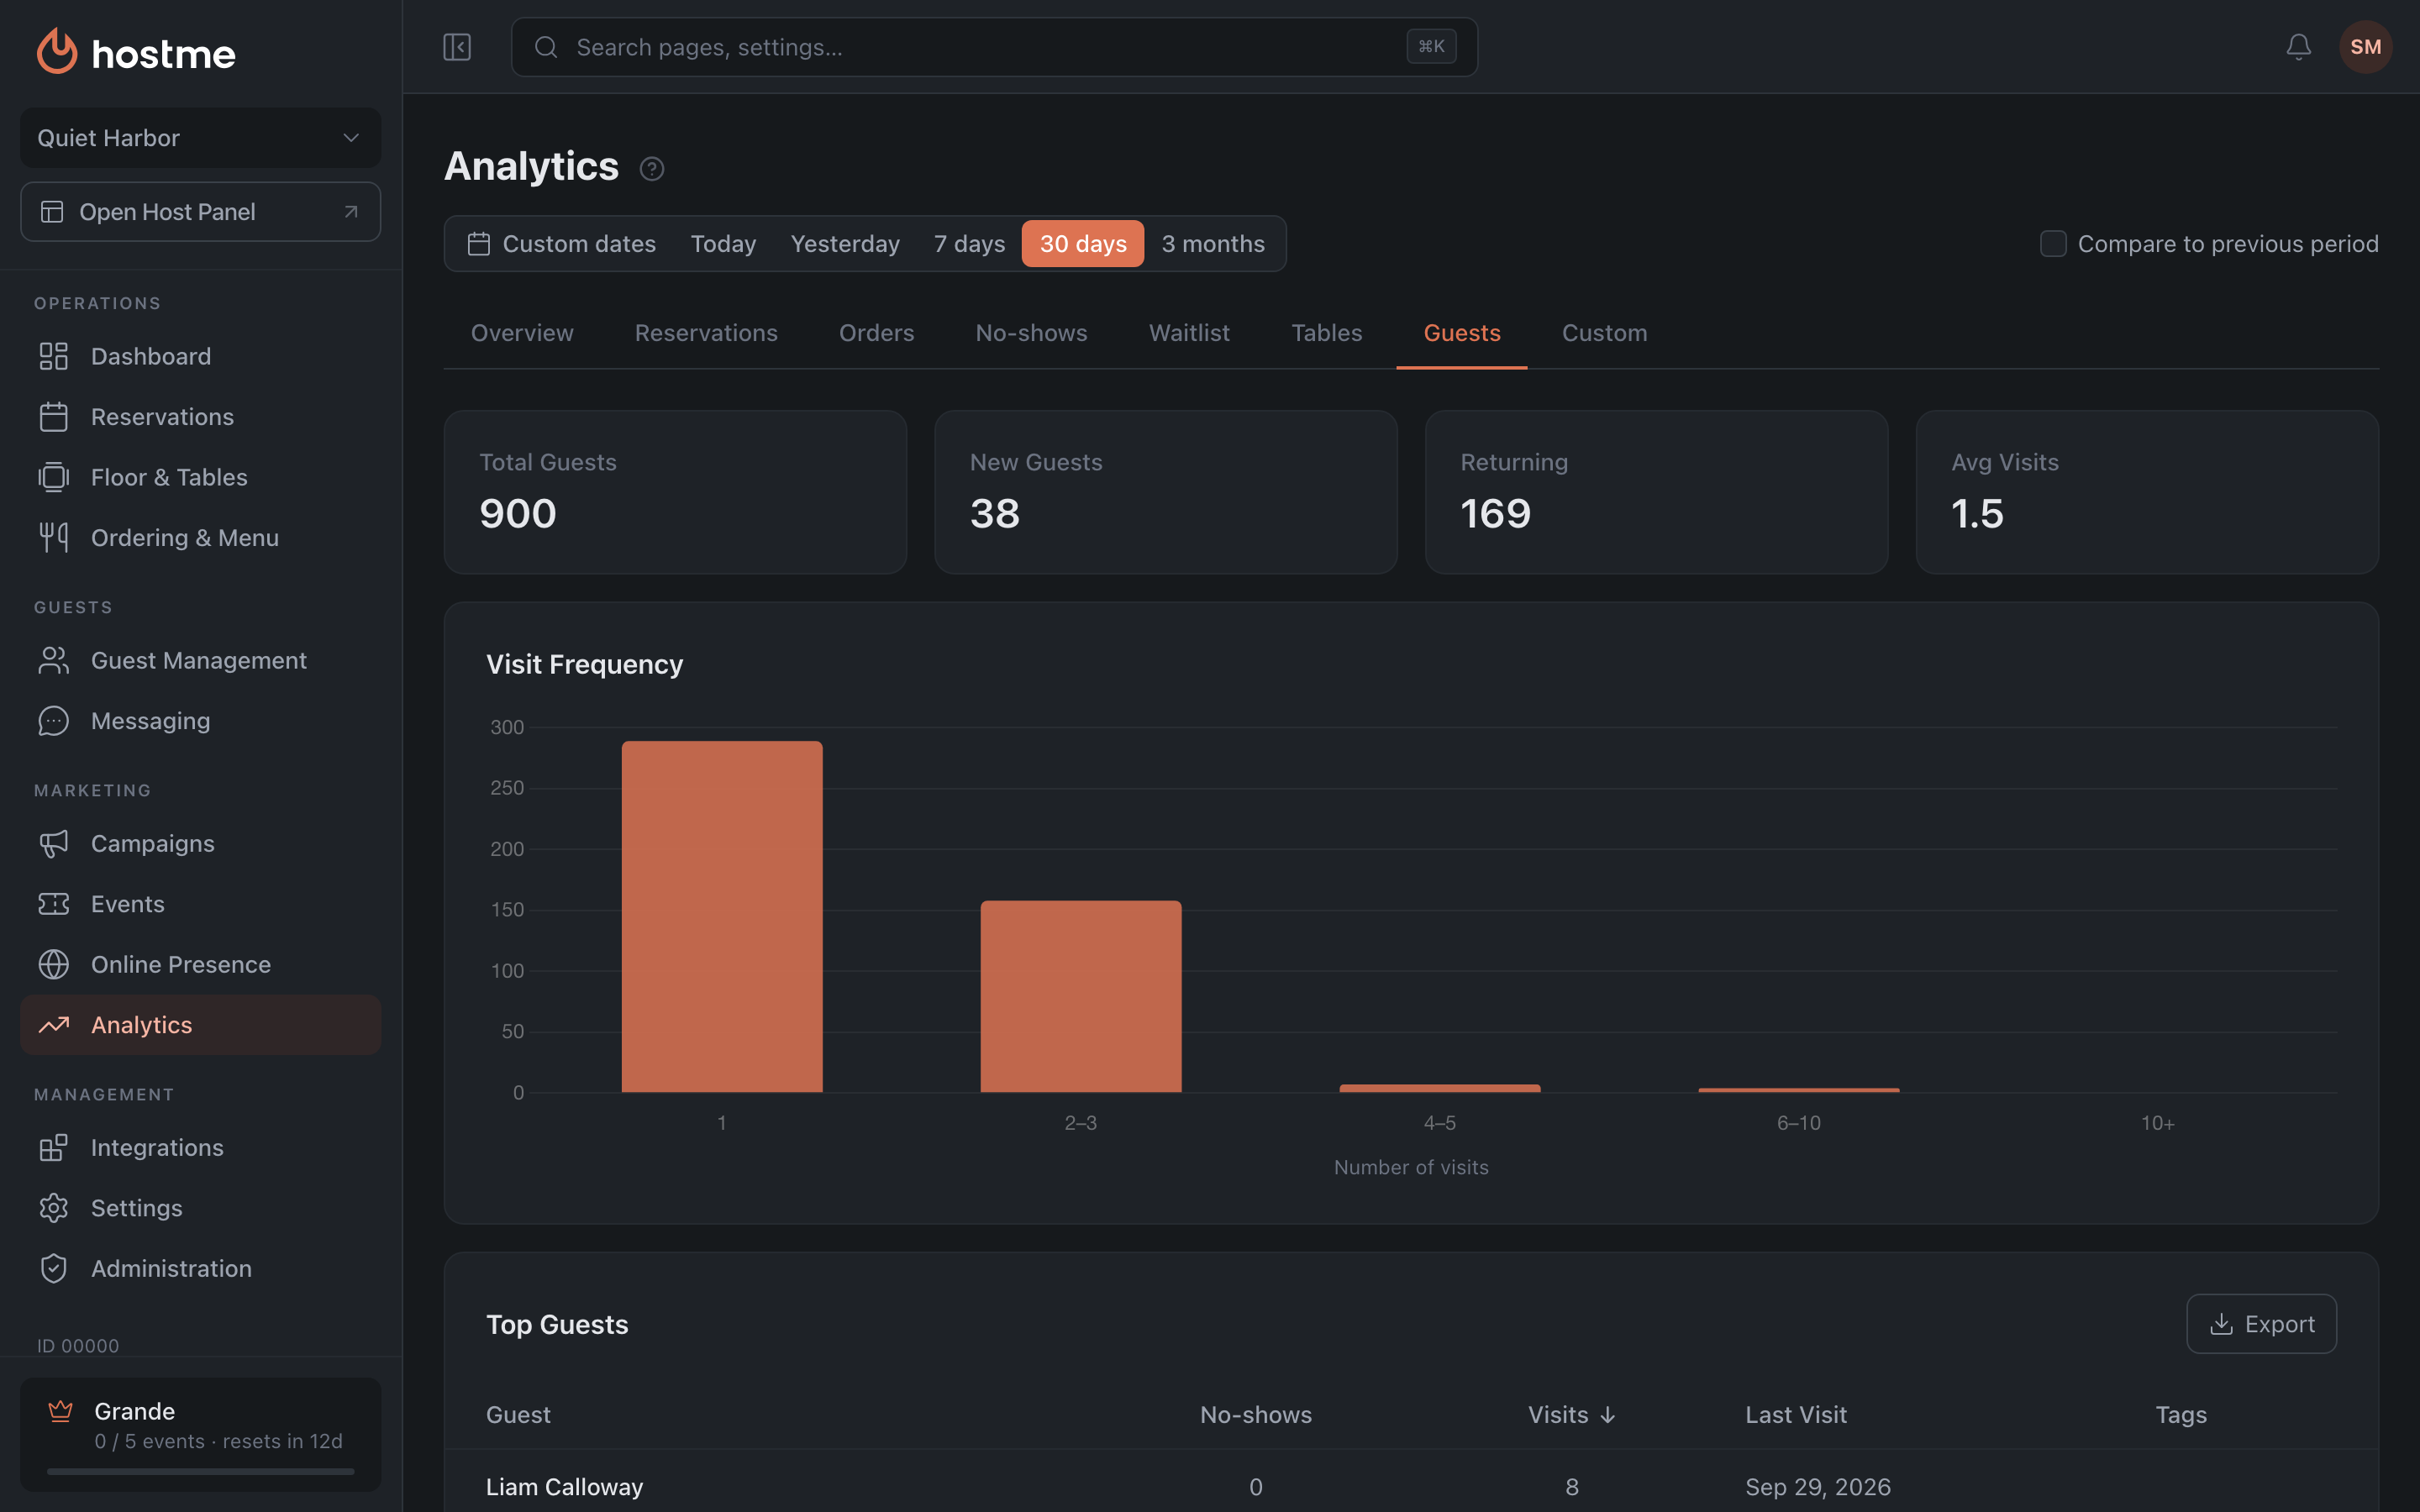
Total, new and returning guests, visit frequency, the “Top Guests” table (with export; clicking opens the guest profile). The ratio of new to returning answers where to put your money: into attracting guests, or into keeping them.
Custom (coming soon) Grande
Reports built for a restaurant’s specific question, the ones the standard set doesn’t cover: the Hostme team puts them together on request. The tab is on the way.
Reservation statuses
In Analytics and in the exports a booking has one of these statuses:
| Status | What it means |
|---|---|
| Pending | the booking is waiting for the restaurant’s decision — this happens when bookings are approved manually |
| Confirmed | the booking is accepted, the guests are expected |
| Seated | the guests are at the table now |
| Closed | the visit is over |
| No-show | the guests didn’t come, and the restaurant marked a no-show |
| Canceled by restaurant | the restaurant canceled the booking |
| Rejected | the restaurant didn’t accept a booking that was waiting for approval |
| Canceled by guest | the guest canceled the booking themselves |
In the Host Panel the same statuses are labeled a little differently, and all cancellations are grouped into one “Canceled” — see Booking statuses.
Where each status counts:
- “Total Reservations” — every dining-room booking except rejected ones. Delivery and takeaway orders are not included.
- “Reservations by Status” on the Overview — the same bookings by status, as a percentage of “Total Reservations”; rejected ones aren’t shown here. There is no separate “cancellation rate” figure: it is the sum of the “Canceled by restaurant” and “Canceled by guest” rows.
- “Online Requests” on the Overview — online bookings with the statuses “Pending”, “Confirmed” and “Rejected”. The card is shown only when bookings are approved manually.
- “No-show Rate” — no-shows divided by “Total Reservations”.
- “Canceled” on the No-shows tab — bookings canceled by the restaurant and by the guest together.
- “Avg Party Size” — only bookings that took place, without cancellations, rejections and no-shows.
- Exports — every status, “Rejected” included. In the visits export, walk-ins and waitlist entries have the same labels plus “Called” — the waitlist guest was called to a table.
Export
- Export visits — on the Overview tab, in the “Daily Covers” card. Every visit for the period in one CSV: bookings, walk-ins and the waitlist; the “Type” column tells them apart.
- Export bookings — on the Reservations tab, in the “Reservation Volume” card. Dining-room bookings only.
- Export orders — on the Orders tab, in the “Daily Orders” card. Every delivery, takeaway and preorder for the period — with items, amounts and payment method.
- Export — on the No-shows, Tables and Guests tabs: the tab’s table as CSV.
The visits and bookings files contain the visit date and time, when the booking was created, the guest, phone, party size, table, status, source, channel and deposit. Times are in the restaurant’s local time and its time format. Delivery and takeaway orders are not included in these files. Orders have their own export on the Orders tab.
The orders file contains the order number and type (delivery, takeaway or preorder), status, when it was created, the due date and time, the guest, phone, delivery address, items, subtotal, delivery fee, taxes, tips, total, payment method, the amount paid, source and channel.
- Preorders are in the file but not in the Orders tab figures — there they are counted with bookings. So the file can have more rows than “Total Orders”.
- The delivery discount is already taken into account in the “Delivery fee” column. The “Delivery discount” column is for reference — don’t subtract it from the total again. Total = subtotal + delivery fee + tips (plus taxes, if they aren’t included in prices).
- For a long period the export takes longer — the button shows how many orders are ready. If some orders couldn’t be loaded, the file won’t download and the panel will ask you to try again: you never get an incomplete file.
- Times are in the restaurant’s local time and its time format, as in the other exports.